Neural Network Driven Insights into Electricity Consumption Data During COVID-19
 Image credit: Johan Extra
The ongoing COVID-19 pandemic has caused widespread disruptions to everyday life and the global economy. Many existing forecast models no longer provide the same accuracy they once did. Consequently, being able to account for the change in conditions would prove quite valuable.
High resolution electricity consumption data is a potential proxy for economic activity. The nexus between electricity consumption and GDP is a widely debated topic. A McKinsey quarterly article suggests that decoupling of GDP and energy growth occurs as economies advance.
Journal articles which demonstrate a link between reduced electricity consumption as a result of COVID-19 restrictions are starting to appear.
In my blog posts; A, B, C, and D I explore Australian electricity consumption data for observable patterns that can be attributed to restrictions brought on by COVID-19. This blog post will demonstrate how I detected a change in Victorian electricity consumption which can be attributed to COVID-19 restrictions.
The rest of this post outlines the:
- methodology used,
- key results & discussion, and
- conclusions.
Methodology
To deliver meaningful results in a short time I committed to posting weekly blog posts on LinkedIn. These blog posts enabled me to produce results straight away, scale my project accordingly, and gain valuable feedback from interested data scientists. The blog posts covered:
- Exploratory Data Analysis,
- tracking model development,
- model drift, and
- a way to attribute forecast errors to COVID-19 restrictions.
I will now provide an overview of the key results and discussions to be found in my blog posts.
Results & Discussion
Victoria has had the most severe restrictions in Australia. Consequently, Victorian electricity consumption is most likely to be impacted by COVID-19 restrictions. Before developing a model, it is essential that the data and its potential errors are understood.

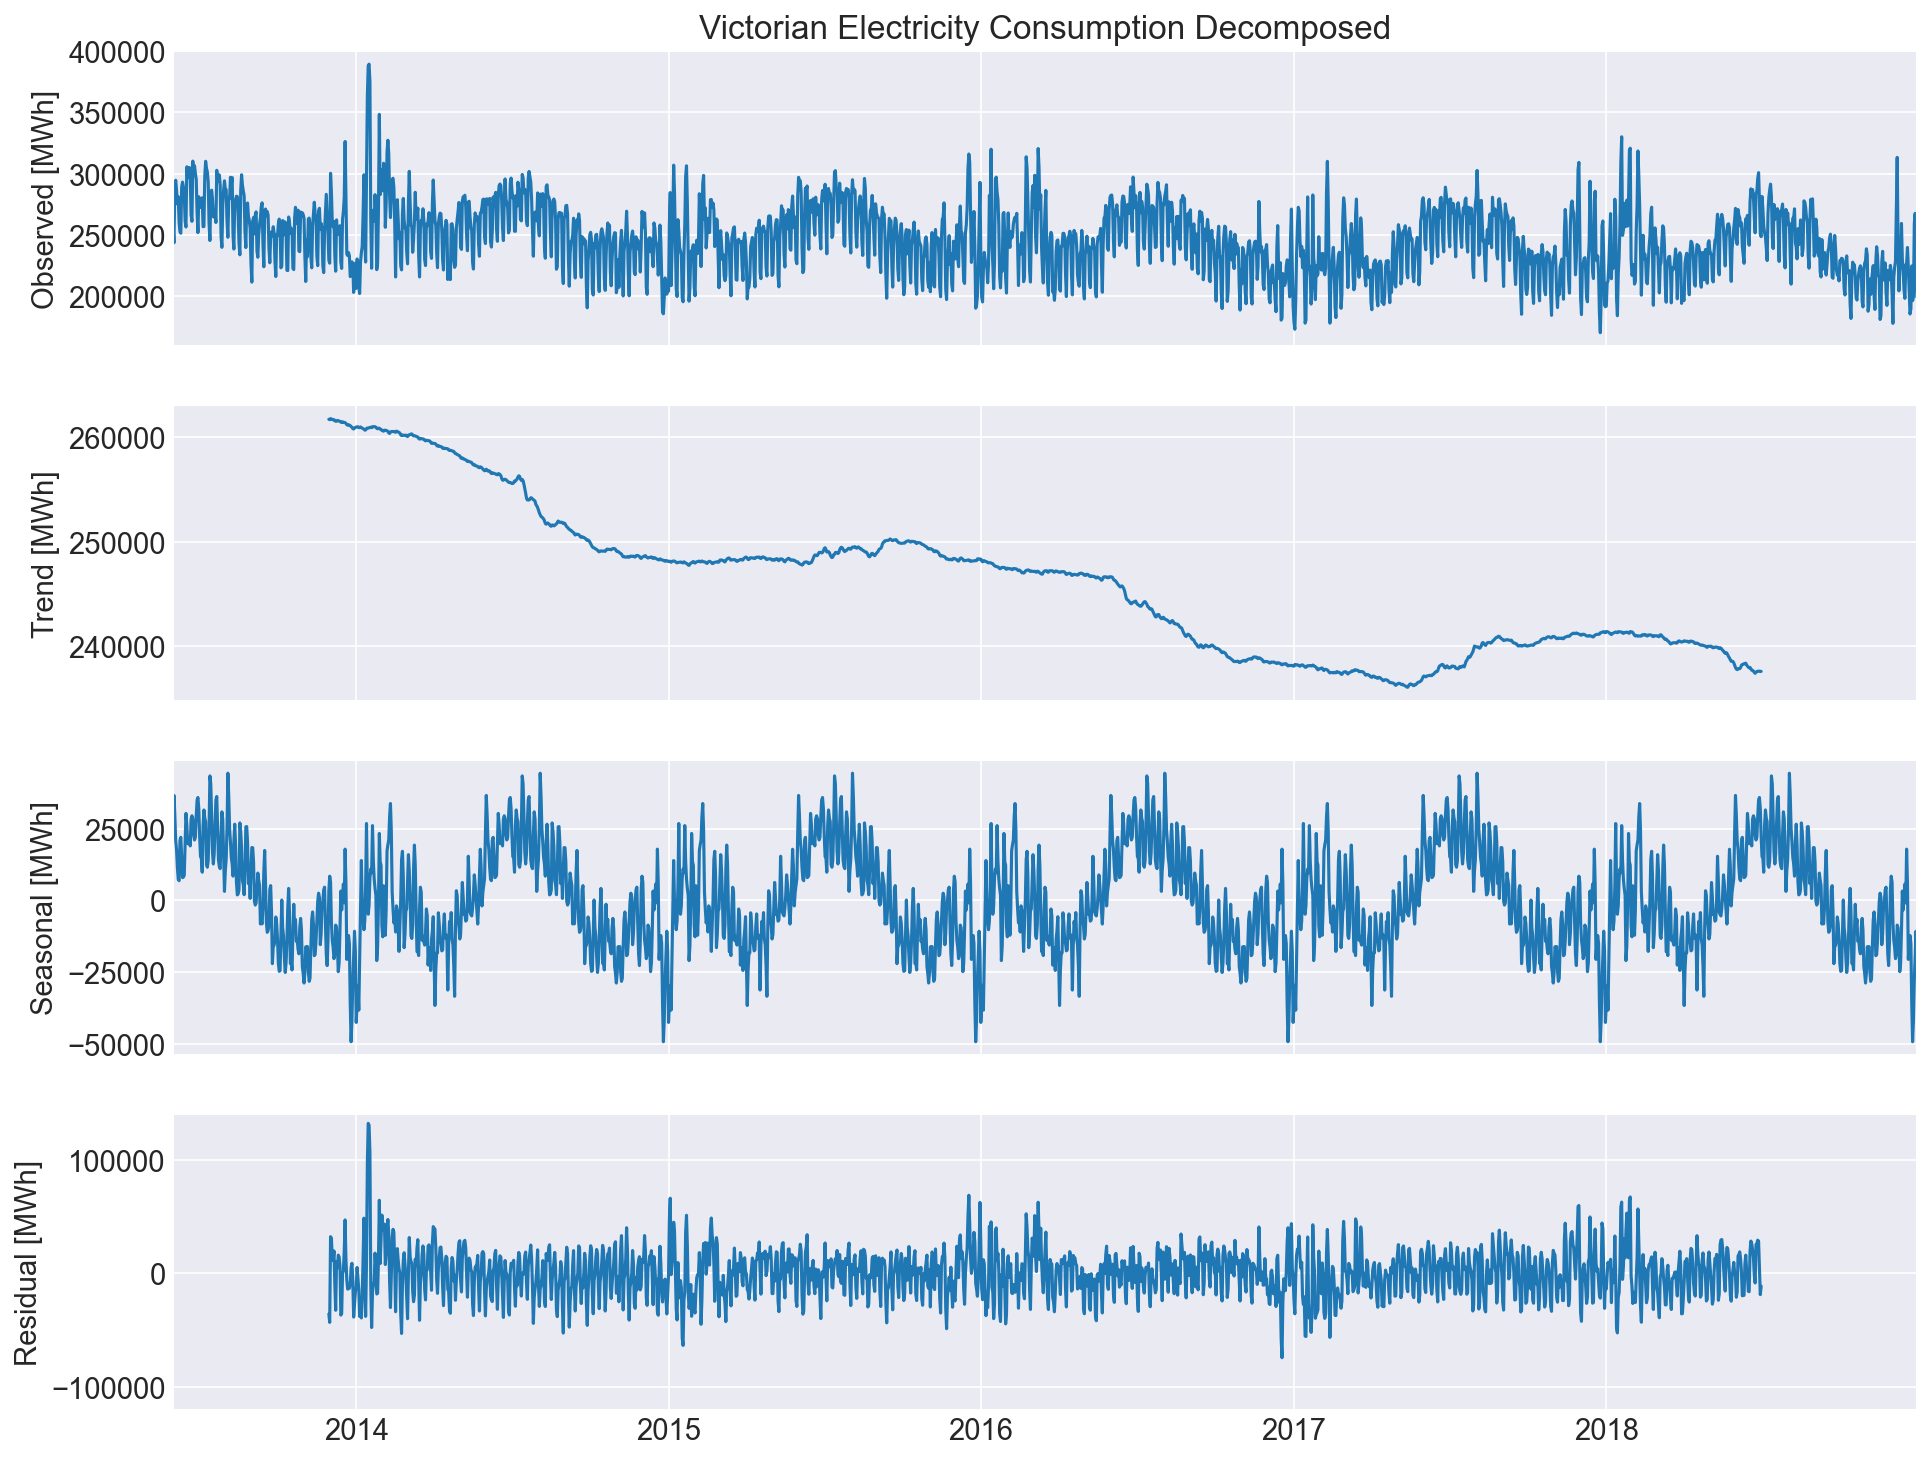
Key takeaways from decomposing the Victorian electricity consumption data are:
- There is a slight downward trend which may be attributable to the adoption of renewable energy and efficiency measures.
- There is a clear seasonality with peak consumption occurring throughout winter.
- Errors are most obvious near the start of the year.
Using one step ahead forecasts, the Holt-Winters’ triple exponential smoother is used as a benchmark to track value gained from adding causal variables as inputs to MLP and LSTM neural networks are explored.

Key takeaways from tracking model development are:
- Both LSTM and MLP neural networks outperform the benchmark.
- The MLP significantly improves when the day of the week is included.
- The LSTM significantly improves when maximum and minimum temperatures are included.
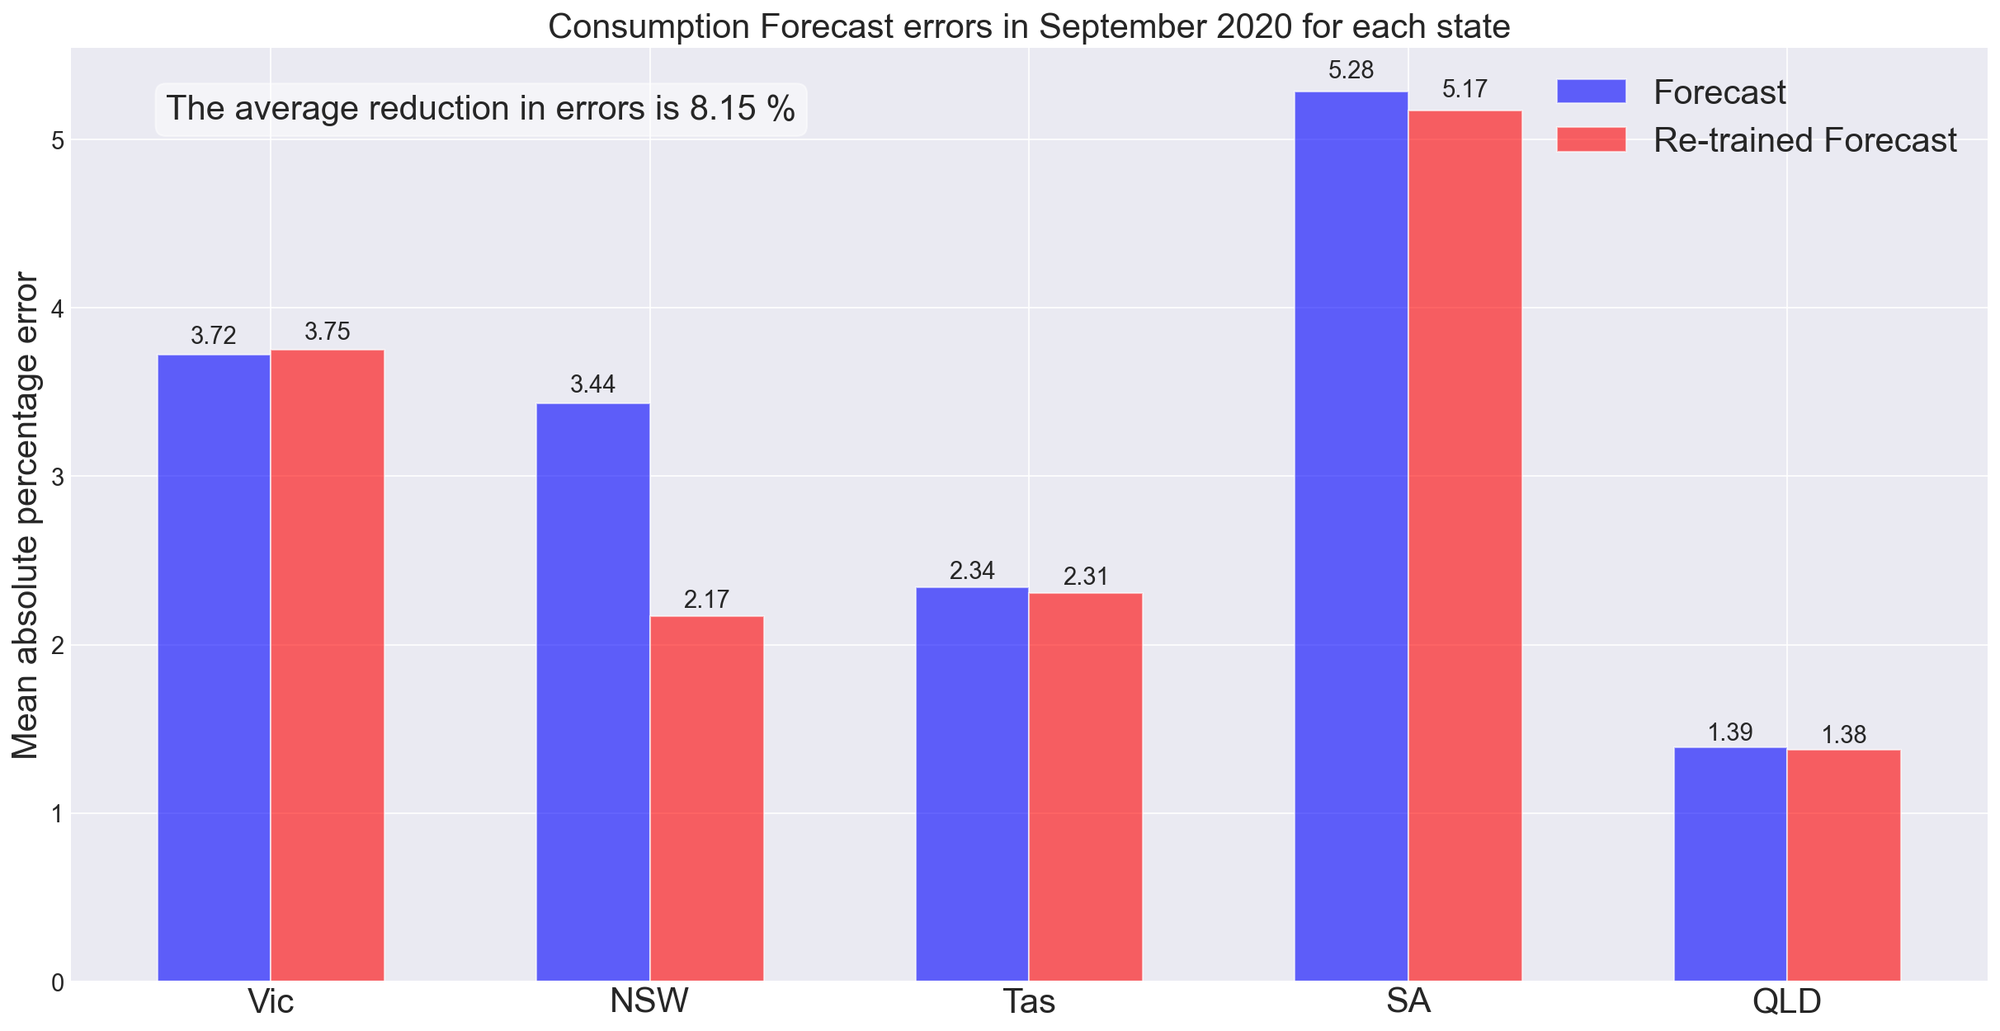
I now explore how errors can be reduced by retraining the MLP neural network to prevent model drift.

Key takeaways from tracking model drift are:
- By tracking model drift average reductions in forecast errors 8.15% can be observed.
- A reduction of errors is not guaranteed.
- As seen in blog C forecast errors do not drift significantly from the test data set.
After developing a robust model that performs well in a number of states it is not difficult to scale the solution to a 30-minute one step ahead forecast model.
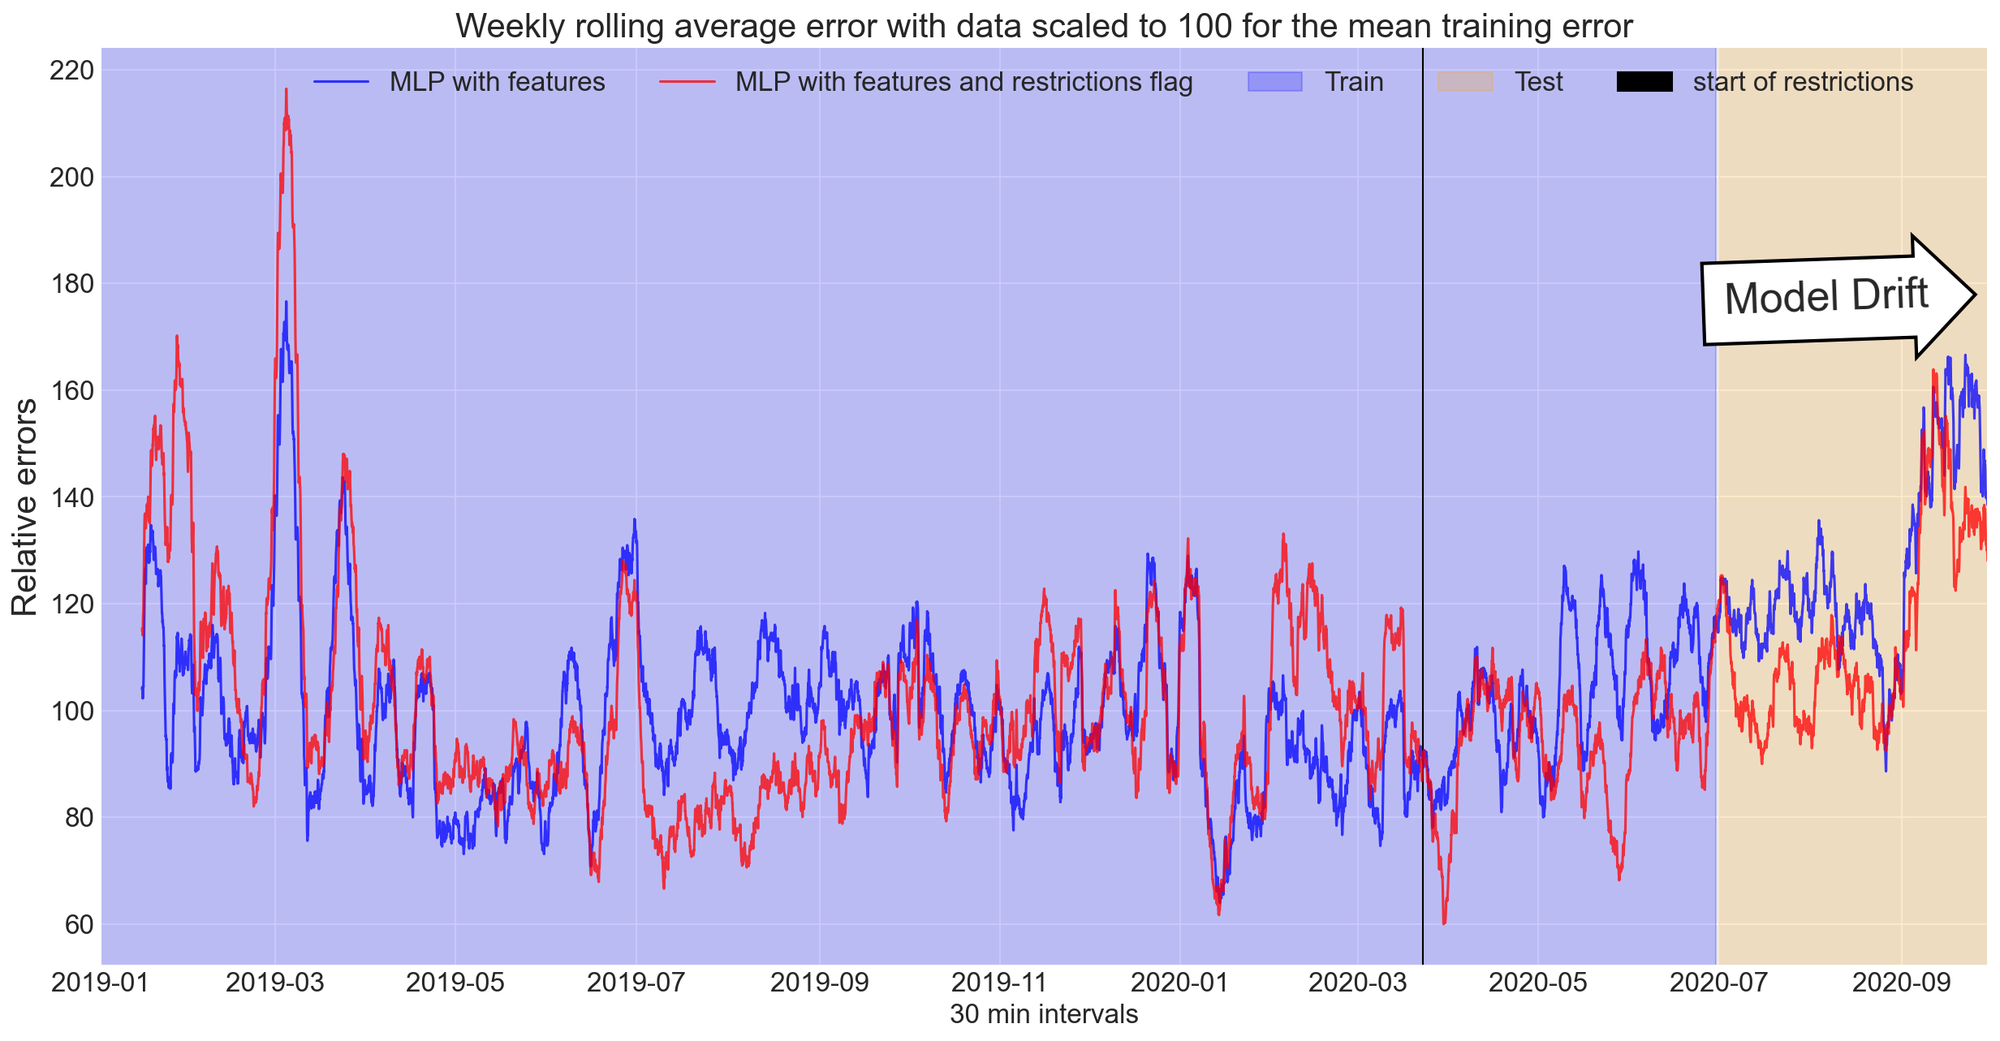
To avoid electricity consumption data during COVID-19 restrictions leaking into our model and preventing us from detecting a change attributable to COVID-19 restrictions, the following model does not use past electricity consumption data as an input variable.
By setting a binary vector to 1 from the start of COVID-19 restrictions in Australia we can determine if our MLP neural network can learn a different pattern for electricity consumption throughout COVID-19 restrictions and provide improved forecasts.

Key takeaways from tracking model drift before and after COVID-19 restrictions are:
- The MLP NN which accounts for COVID-19 restrictions drifts significantly less than its counterpart.
- Errors for both models are comparable before COVID-19 restrictions were put in places.
- We can confidently say that a change in electricity consumption data has been detected for Victoria.
Conclusions
By developing a MLP ANN that uses causal variables to predict step ahead electricity consumption in Victoria, I was able to detect a change in Victorian electricity consumption data which is attributable to COVID-19 restrictions.
Throughout this blog post, I have demonstrated the value of tracking model performance, developing scalable experiments, and obtaining consistent feedback.
Please find my GitHub repository here and current resume here.