Developing Neural Networks to Forecast Electricity Consumption
 Image credit: Pexels
Using the daily Victorian electricity consumption as an example, this blog will outline procedures to develop a forecasting model. To enable scheduling of energy supply for the next day I develop one day ahead forecasts. In my next post I will use this model to outline procedures to improve forecasting capability during uncertain times.
When developing a model, it is easy to get carried away and build a fancy, shiny model which resembles a formula One car. If we are wanting to go off road, then this model/car is next to useless. It is imperative to develop a fit for purpose model and track modeling improvements.
This blog will outline how I have:
- Tracked model development to ensure time is spent on measurable and valuable model improvements.
- Cleaned and explored the data.
- Developed a benchmark forecasting model.
- Developed a LSTM recurrent neural network to forecast electricity consumption.
- Developed a MLP artificial neural network to forecast electricity consumption.
Tracking Model Development
Using the mean absolute percentage error, I demonstrate below one way that improvement can be tracked as model features are added and model complexity grows.
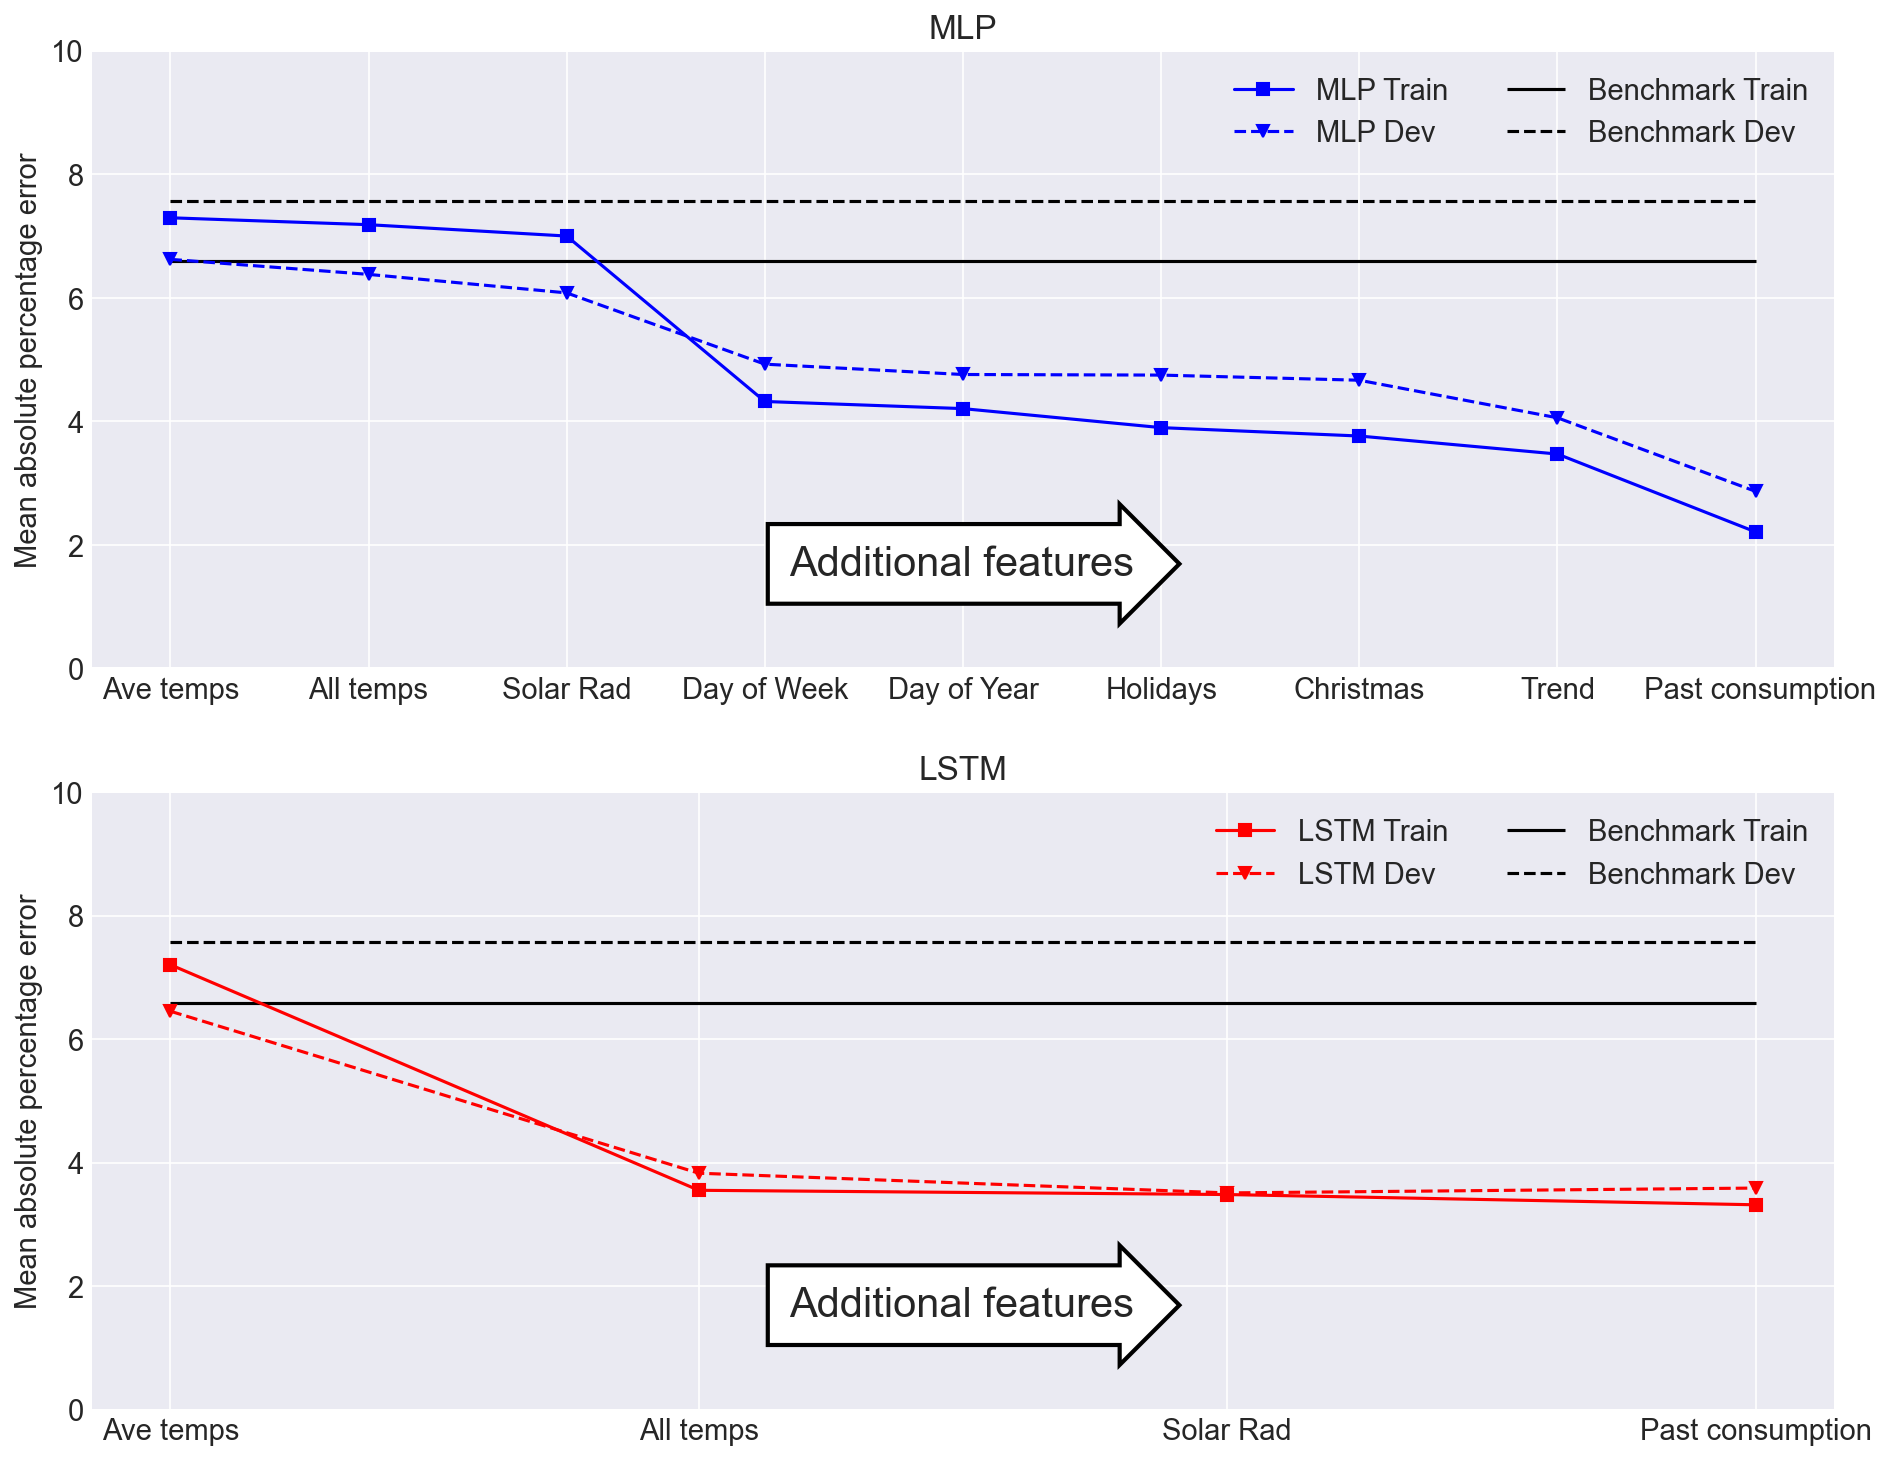
Model performance is greatest when the mean absolute percentage error reaches zero.
Key takeaway messages from tracking model development include:
- Both the MLP and LSTM outperform the benchmark model.
- The MLP significantly improves when the day of the week is included.
- The LSTM significantly improves when maximum and minimum temperatures are included.
At this point it is essential to ask “will the end user benefit from further model development”?
Data Cleaning and Exploratory Data Analysis
I now outline the process used to develop these models.
Models are only ever as good as the data they are built on and the understanding of the key variables which cause a change in the observations.
This dataset was checked for:
- Missing data points.
- Outliers.
- General inconsistencies.
Now we can explore the data and look for hints that will help us construct an appropriate model.
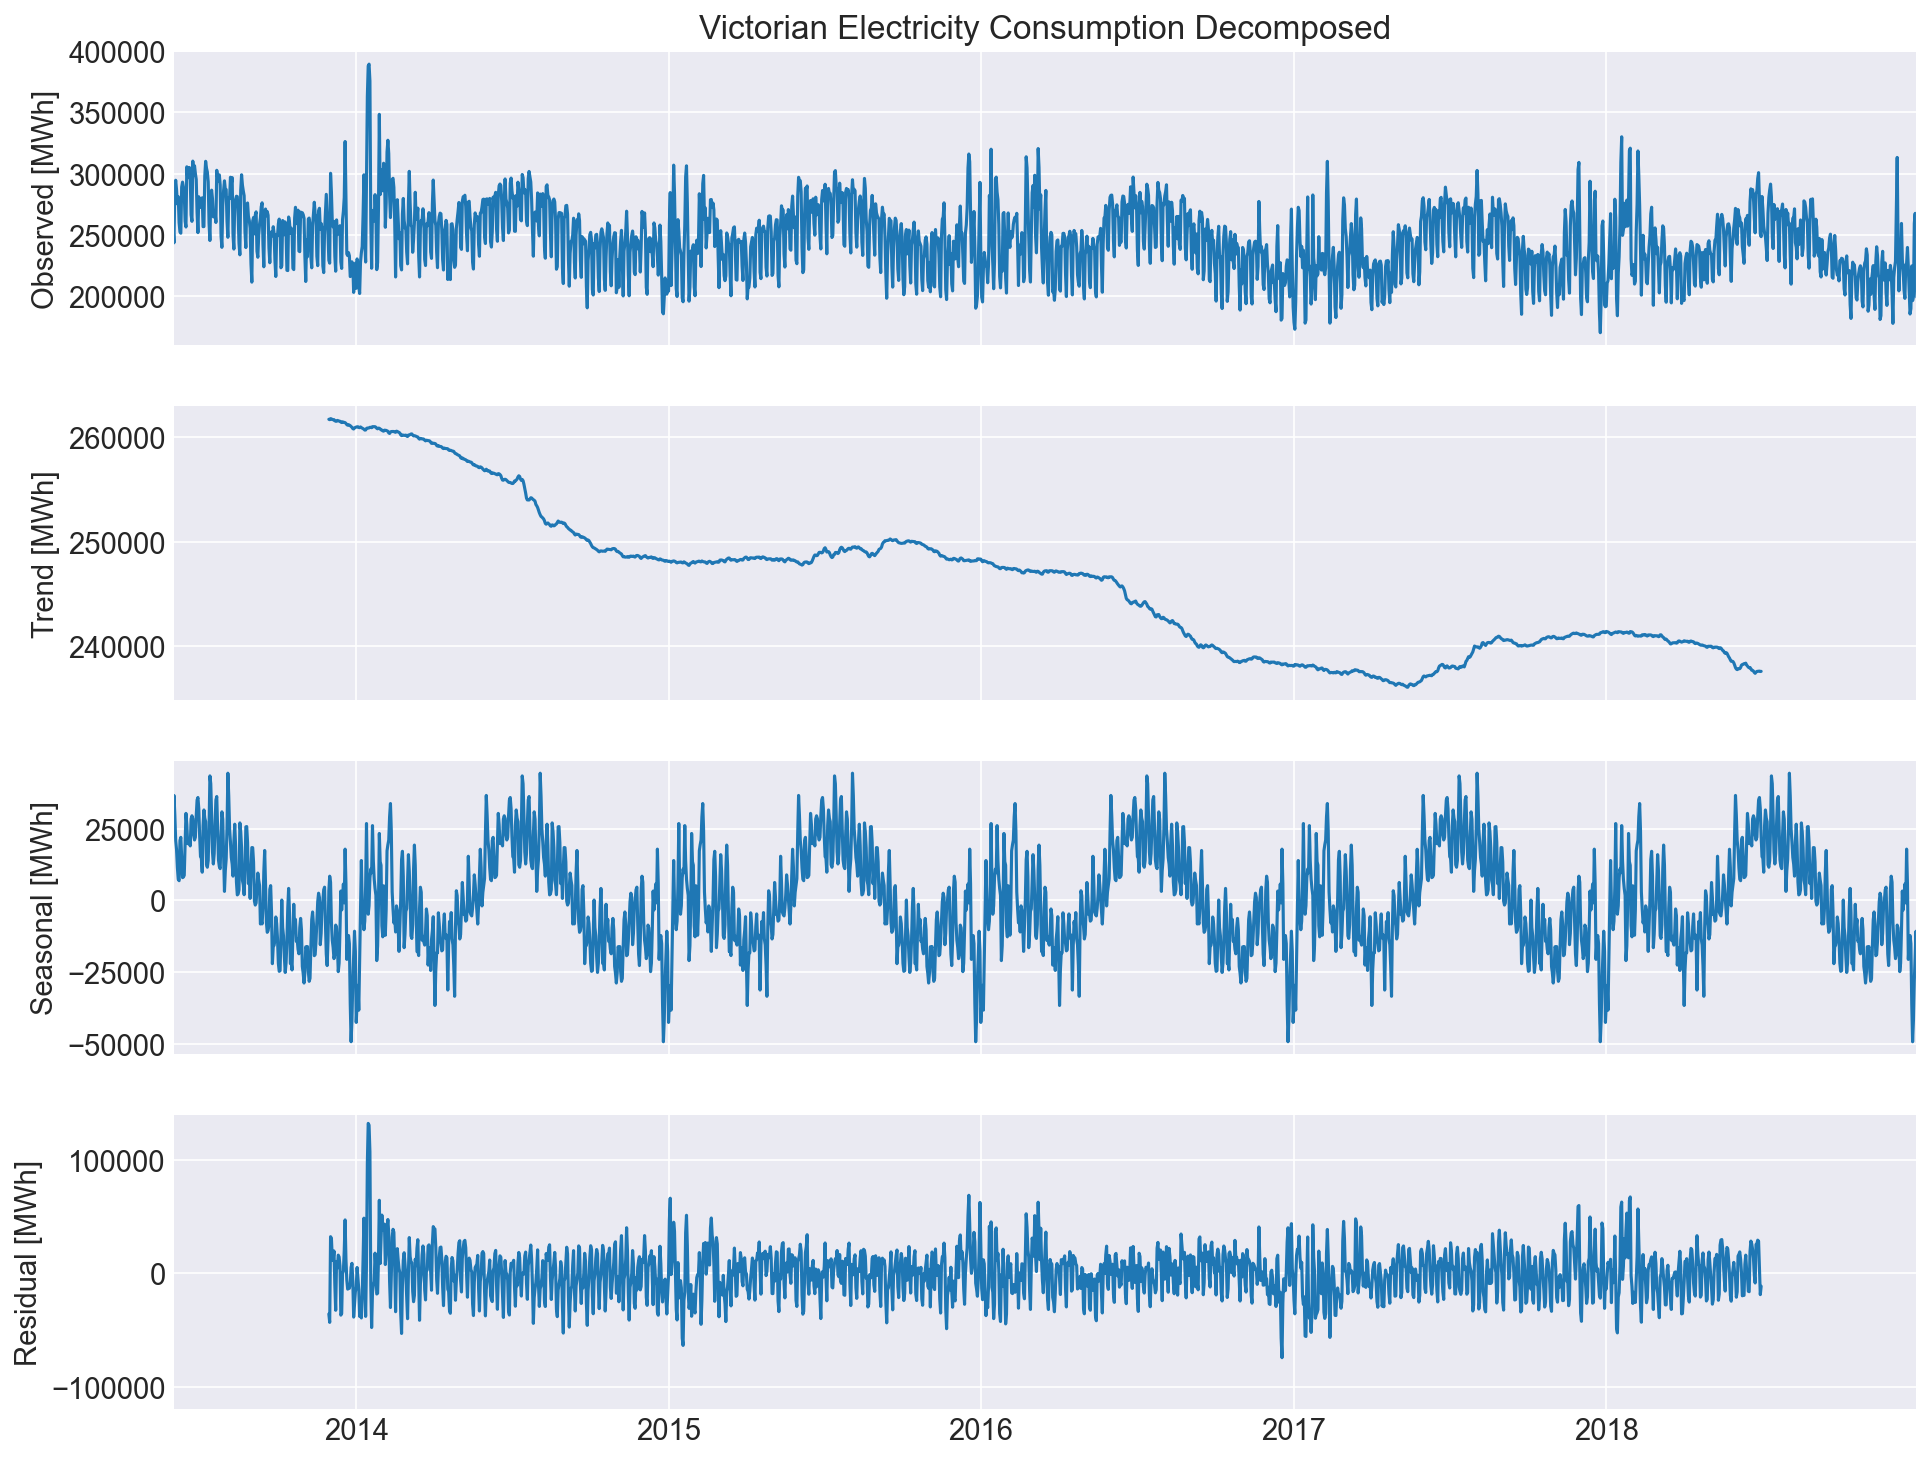
Key takeaway messages from reviewing the decomposed electricity consumption for Victoria include:
- From 2014 to 2019 there is a slight downward trend in electricity consumption, this may be a result of electricity efficiency measures or an uptake in solar panels.
- There is a clear yearly seasonal component that is likely to be a result of seasonal fluctuations in temperature and subsequent heating and cooling consumption.
- The residuals show that errors tend to peak at the beginning of the year.
Benchmark Model
Upon reviewing Statistical and Machine Learning forecasting methods we can see that exponential smoothing models commonly outperform other statistical and machine learning models. Well suited to model seasonality and trend we use the Holt - Winters triple exponential smoother as our benchmark.
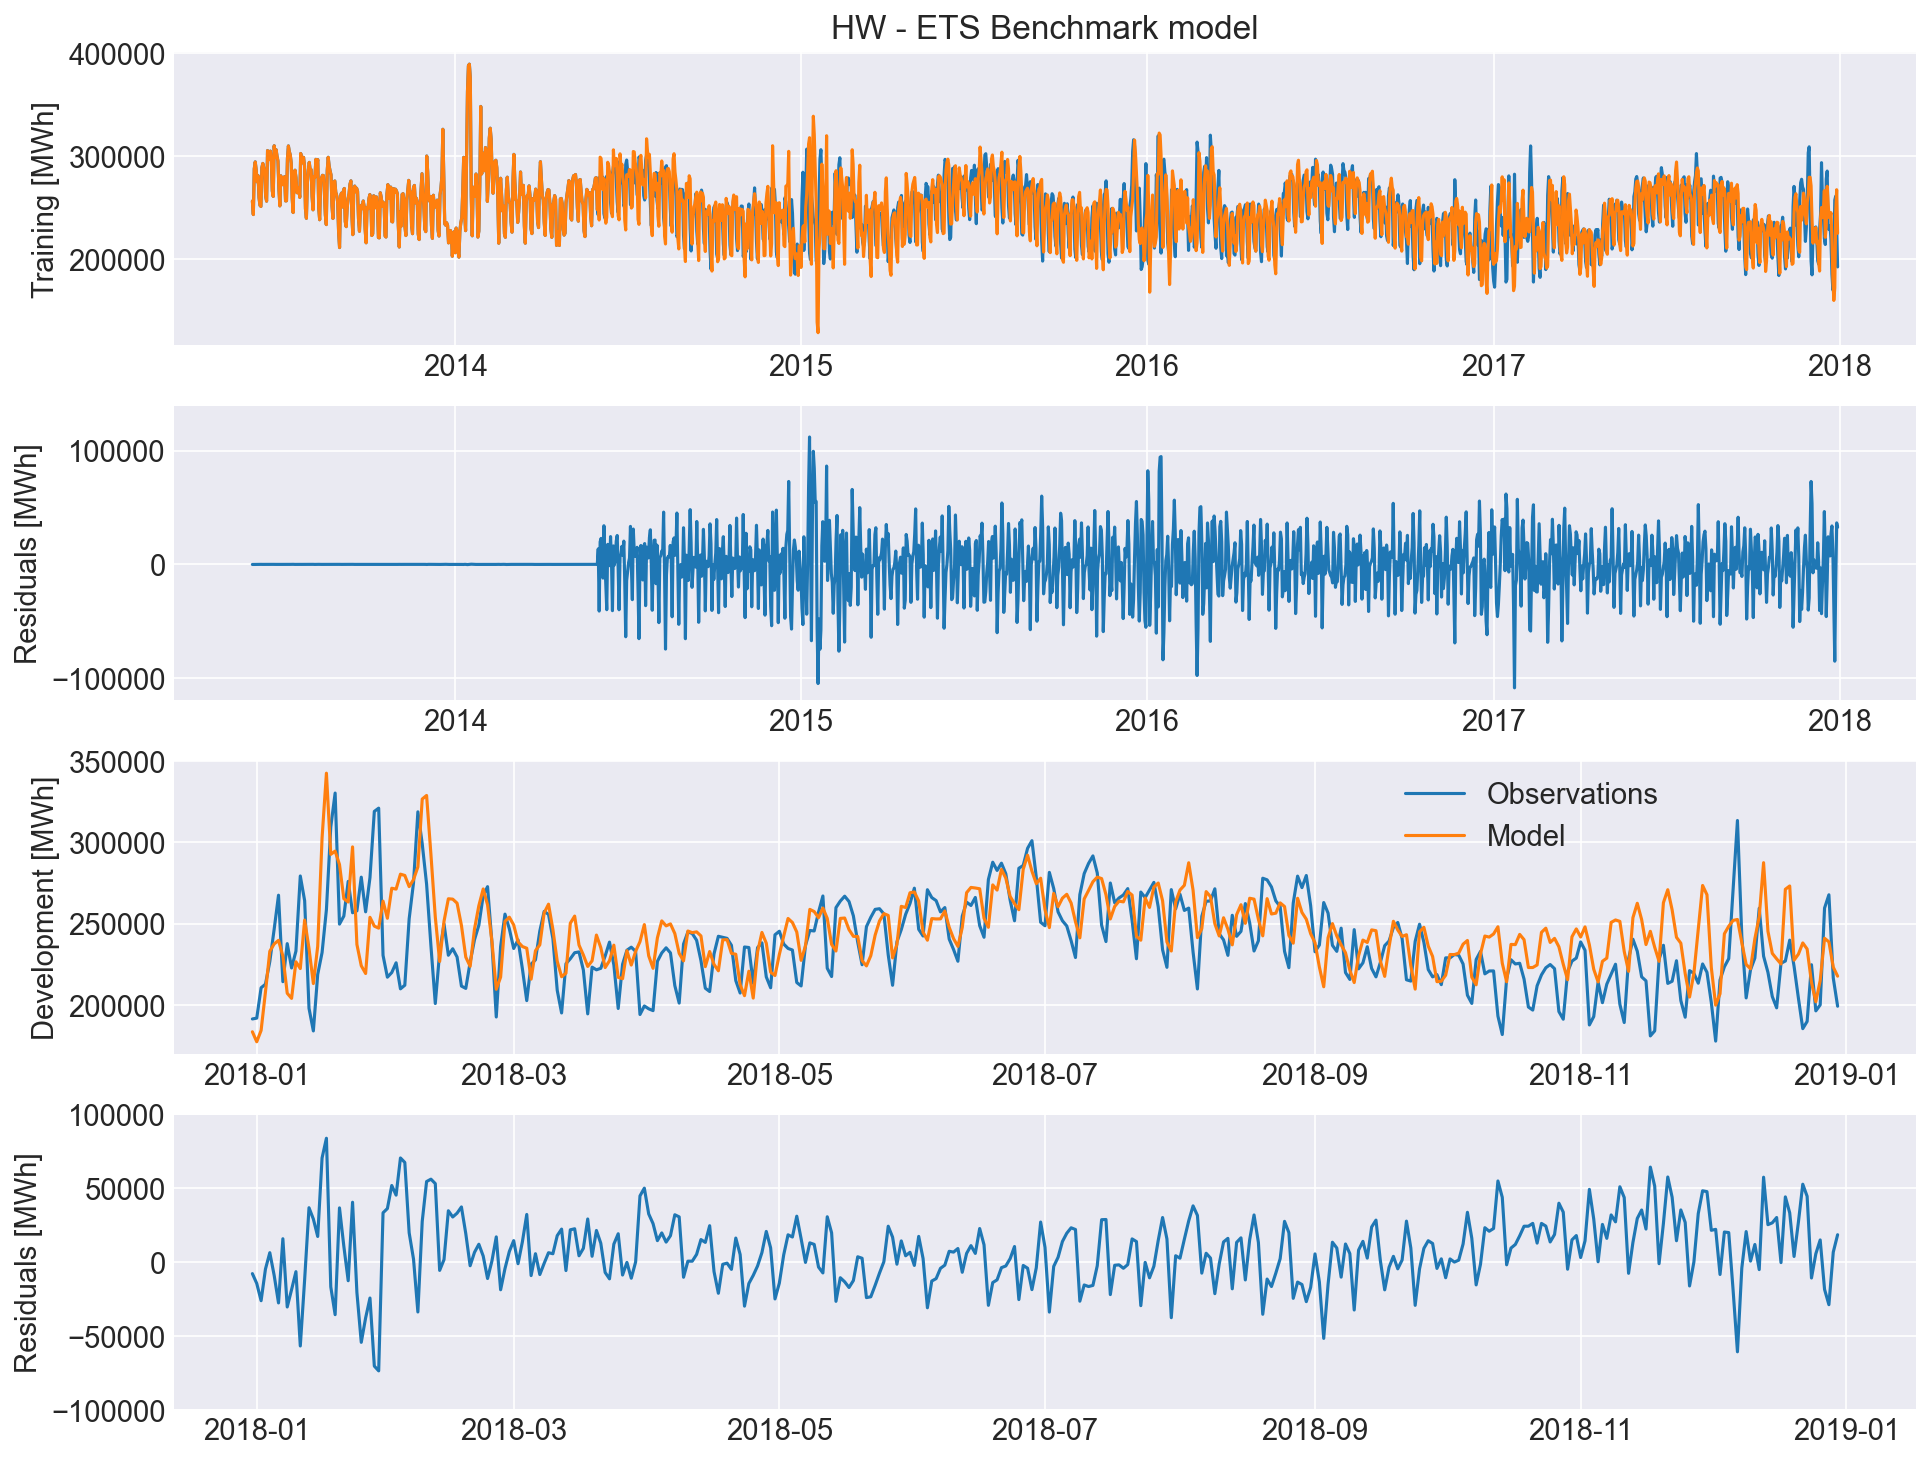
Key takeaway messages from reviewing the benchmark model:
- The benchmark model captures the annual seasonality.
- Residuals in training still show errors peaking at the start of the year.
- The residuals in development show a weekly pattern which is most due to lower electricity consumption on weekends.
Long Short-Term Memory Recurrent Neural Network
The LSTM RNN is a popular choice for time series forecasting. This model learns from the past 7 days of electricity consumption, minimum, maximum, and average temperature, and solar radiation. It is assumed that we will have a good estimate of the next day’s weather.
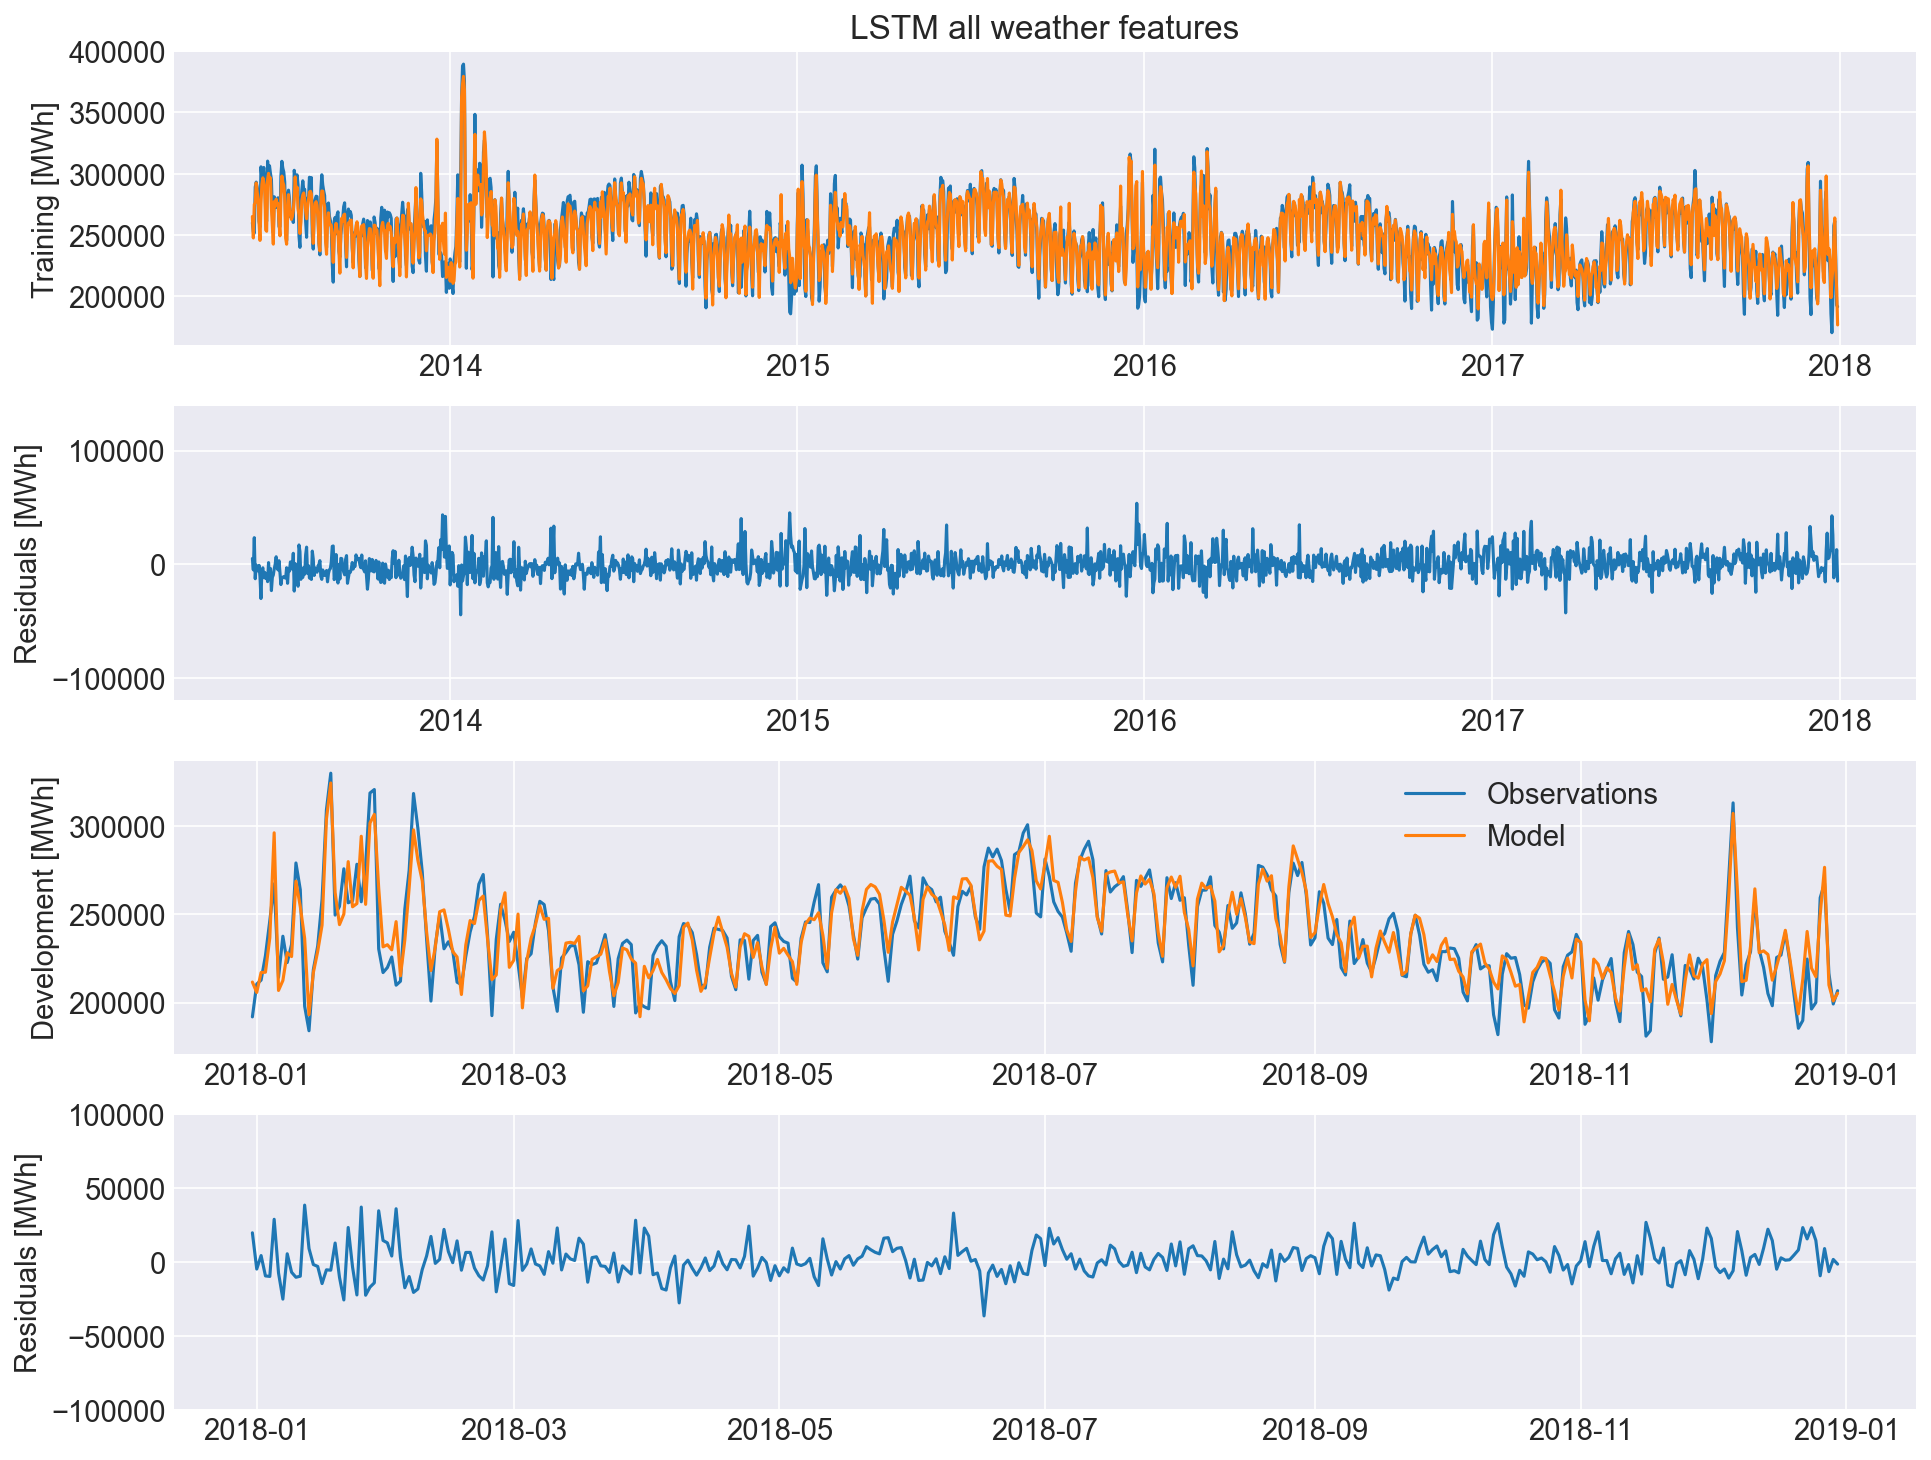
The key takeaway messages from reviewing LSTM model performance are:
- The LSTM significantly out-performs the benchmark model capturing peak consumption much better.
- The residuals in training show that there is a pattern to the errors. These peaks are likely to be around holiday periods.
- The residuals in development still show a weekly pattern.
Multilayer Perceptron Artificial Neural Network
Instead of perceiving electricity consumption as a time series model we can develop a causal model which forecasts electricity consumption as a function of the past 7 days for weather, day of the week and year, holiday period and trend. The MLP ANN is well suited to this task.
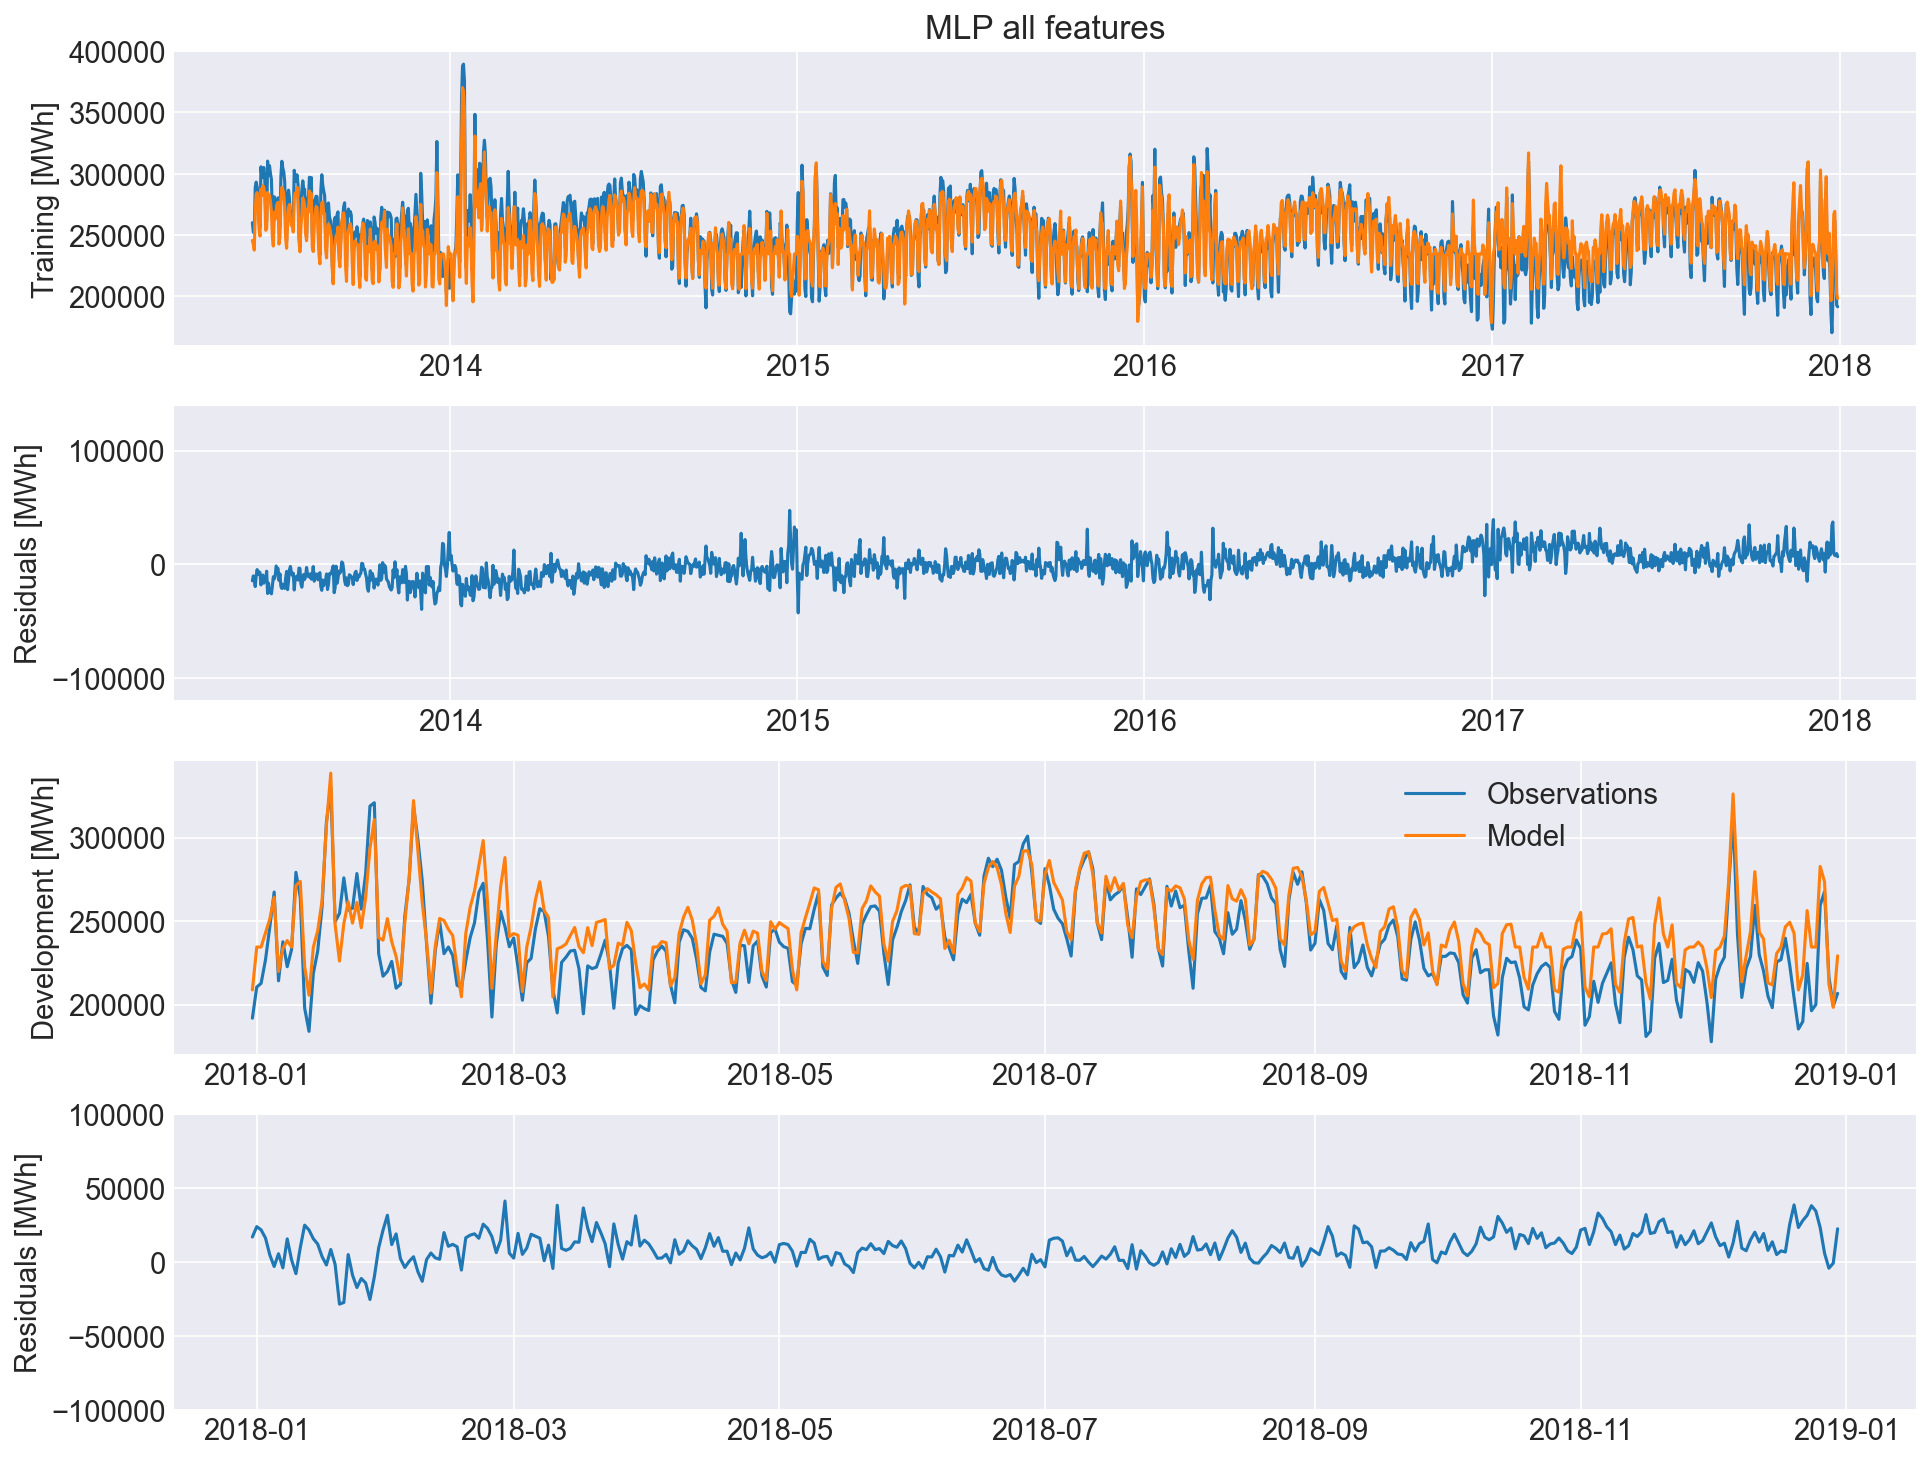
The key takeaway messages from reviewing MLP model performance are:
- Including weekends and holidays which account for behavioural changes commonly associated with changes to electricity consumption significantly improves performance.
- The model tends to under and over-predict peaks and troughs respectively. An alternate loss function may help this.
- Since behaviour is a key element to electricity consumption forecasting, we can expect electricity consumption during the pandemic to be more difficult to forecast.
Summary
In this blog post I provided an overview of one way to develop a benchmark model and use it to track improvements made by other models. Following this procedure allows end users to follow to model development process and identify shortcomings and priorities. It is shown that the MLP which accounts for the day of the week and holidays significantly outperforms the LSTM and benchmark model.
You may have noticed that I did not test the model using Victorian electricity consumption data for 2019 onward. Preventing test data from being used in model development enables us to make more reliable forecasts. Next week I will outline procedures to improve forecasting capability during uncertain times.