Attributing Forecast Errors to COVID-19 Restrictions
 Image credit: Ethan Sees
There are a number of situations in which past data of the observation we are making forecasts for is not available. Possible reasons include time lags between data collection and data availability, and the time taken to quality control data.
Consequently, there is value to be gained by developing predictive models which do not rely on the availability of recent observations of the variable that we are trying to forecast. Further, by developing a causal MLP neural network we are able to attribute changes in electricity consumption to COVID-19 restrictions.
Using 30 minute electricity consumption for Victoria this blog will:
- Develop a feature based causal model used to predict 1 step ahead electricity consumption.
- Develop a model which uses a binary flag to indicate the start of COVID-19 restrictions in Victoria.
- Compare model forecast densities with the observed electricity consumption.
- Use model drift to demonstrate when performance improvements occur.
- Show that by including a binary flag which indicates the start of COVID-19 restrictions, test errors can be reduced by 5.08%
Using a feature based causal MLP ANN to forecast electricity consumption
If we are able to account for all the key variables which drive electricity consumption then we would not need to incorporate past electricity consumption into our causal model. The MLP used to make day one step ahead electricity consumption forecasts uses 6 neurons and is trained with dropout of 6%. The variables included are the past 7 days values for average, minimum and maximum temperature, solar radiation, time of the day, day of the week, public holiday flag, and Christmas holiday flag. Even though similar results were found using the past 24 hours values, values for the past 7 days were used to account for any potential hangover effects from holidays, hot or cold weather spells, or weekends.
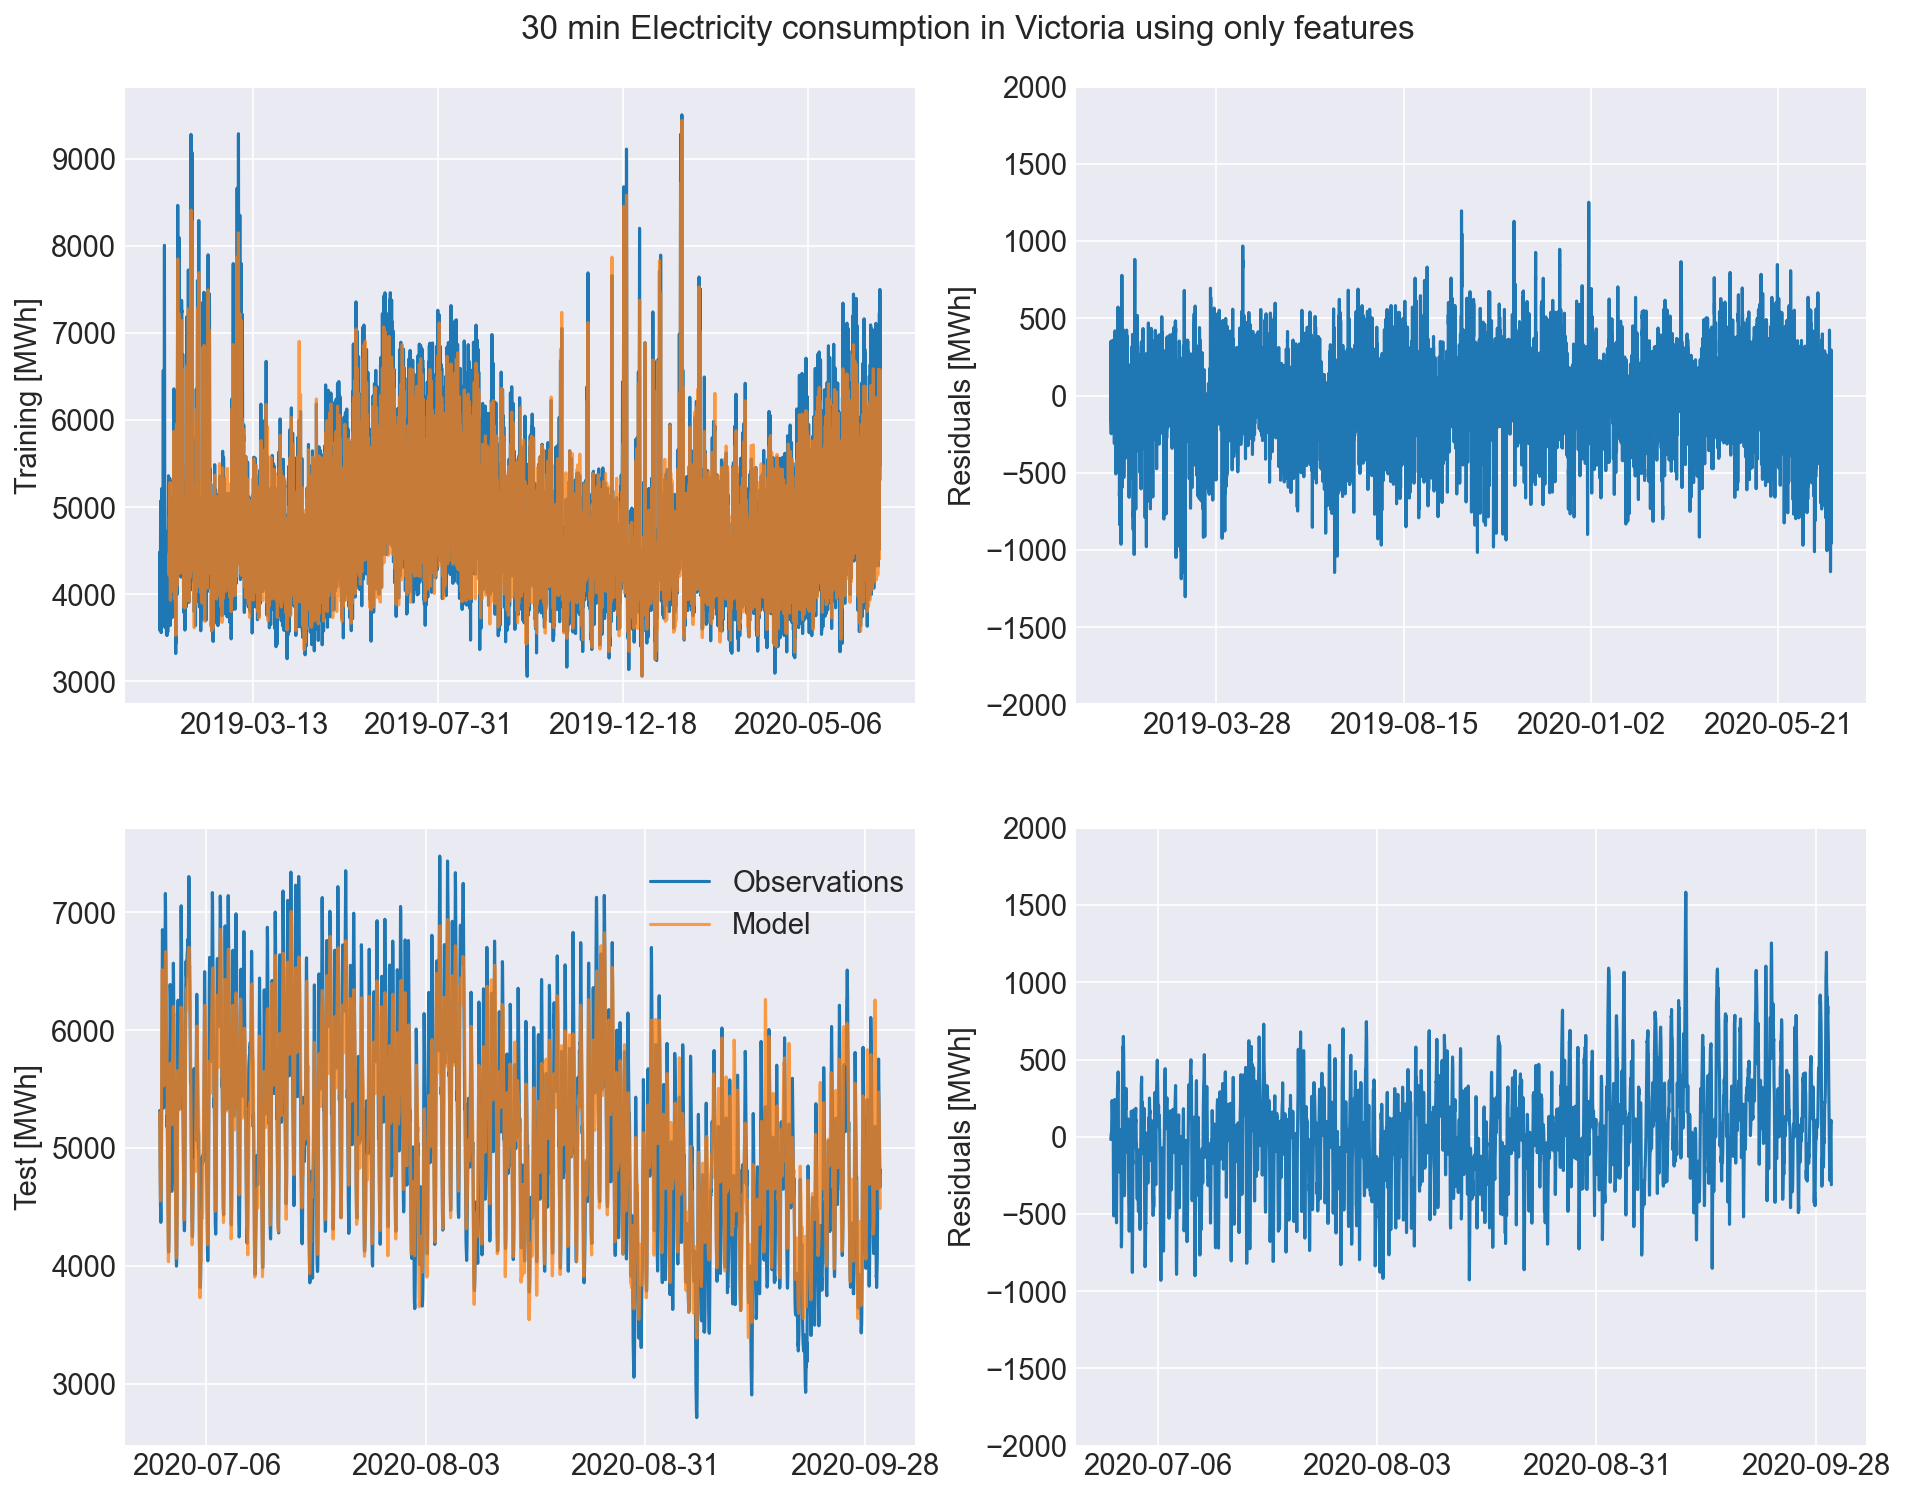
Key takeaway messages from the 30-minute causal model for Victoria include:
- Errors appear to be increasing in the test period.
- High and low electricity consumption forecasts tend to respectively be smaller and larger than observations.
- General consumption trend and seasonality are modelled quite well.
Accounting for COVID-19 restrictions in electricity consumption forecasts
To account for possible behavioural changes due to COVID-19 restrictions in Victoria we now introduce a binary flag that starts on March 23 2020 and persists to the current day.
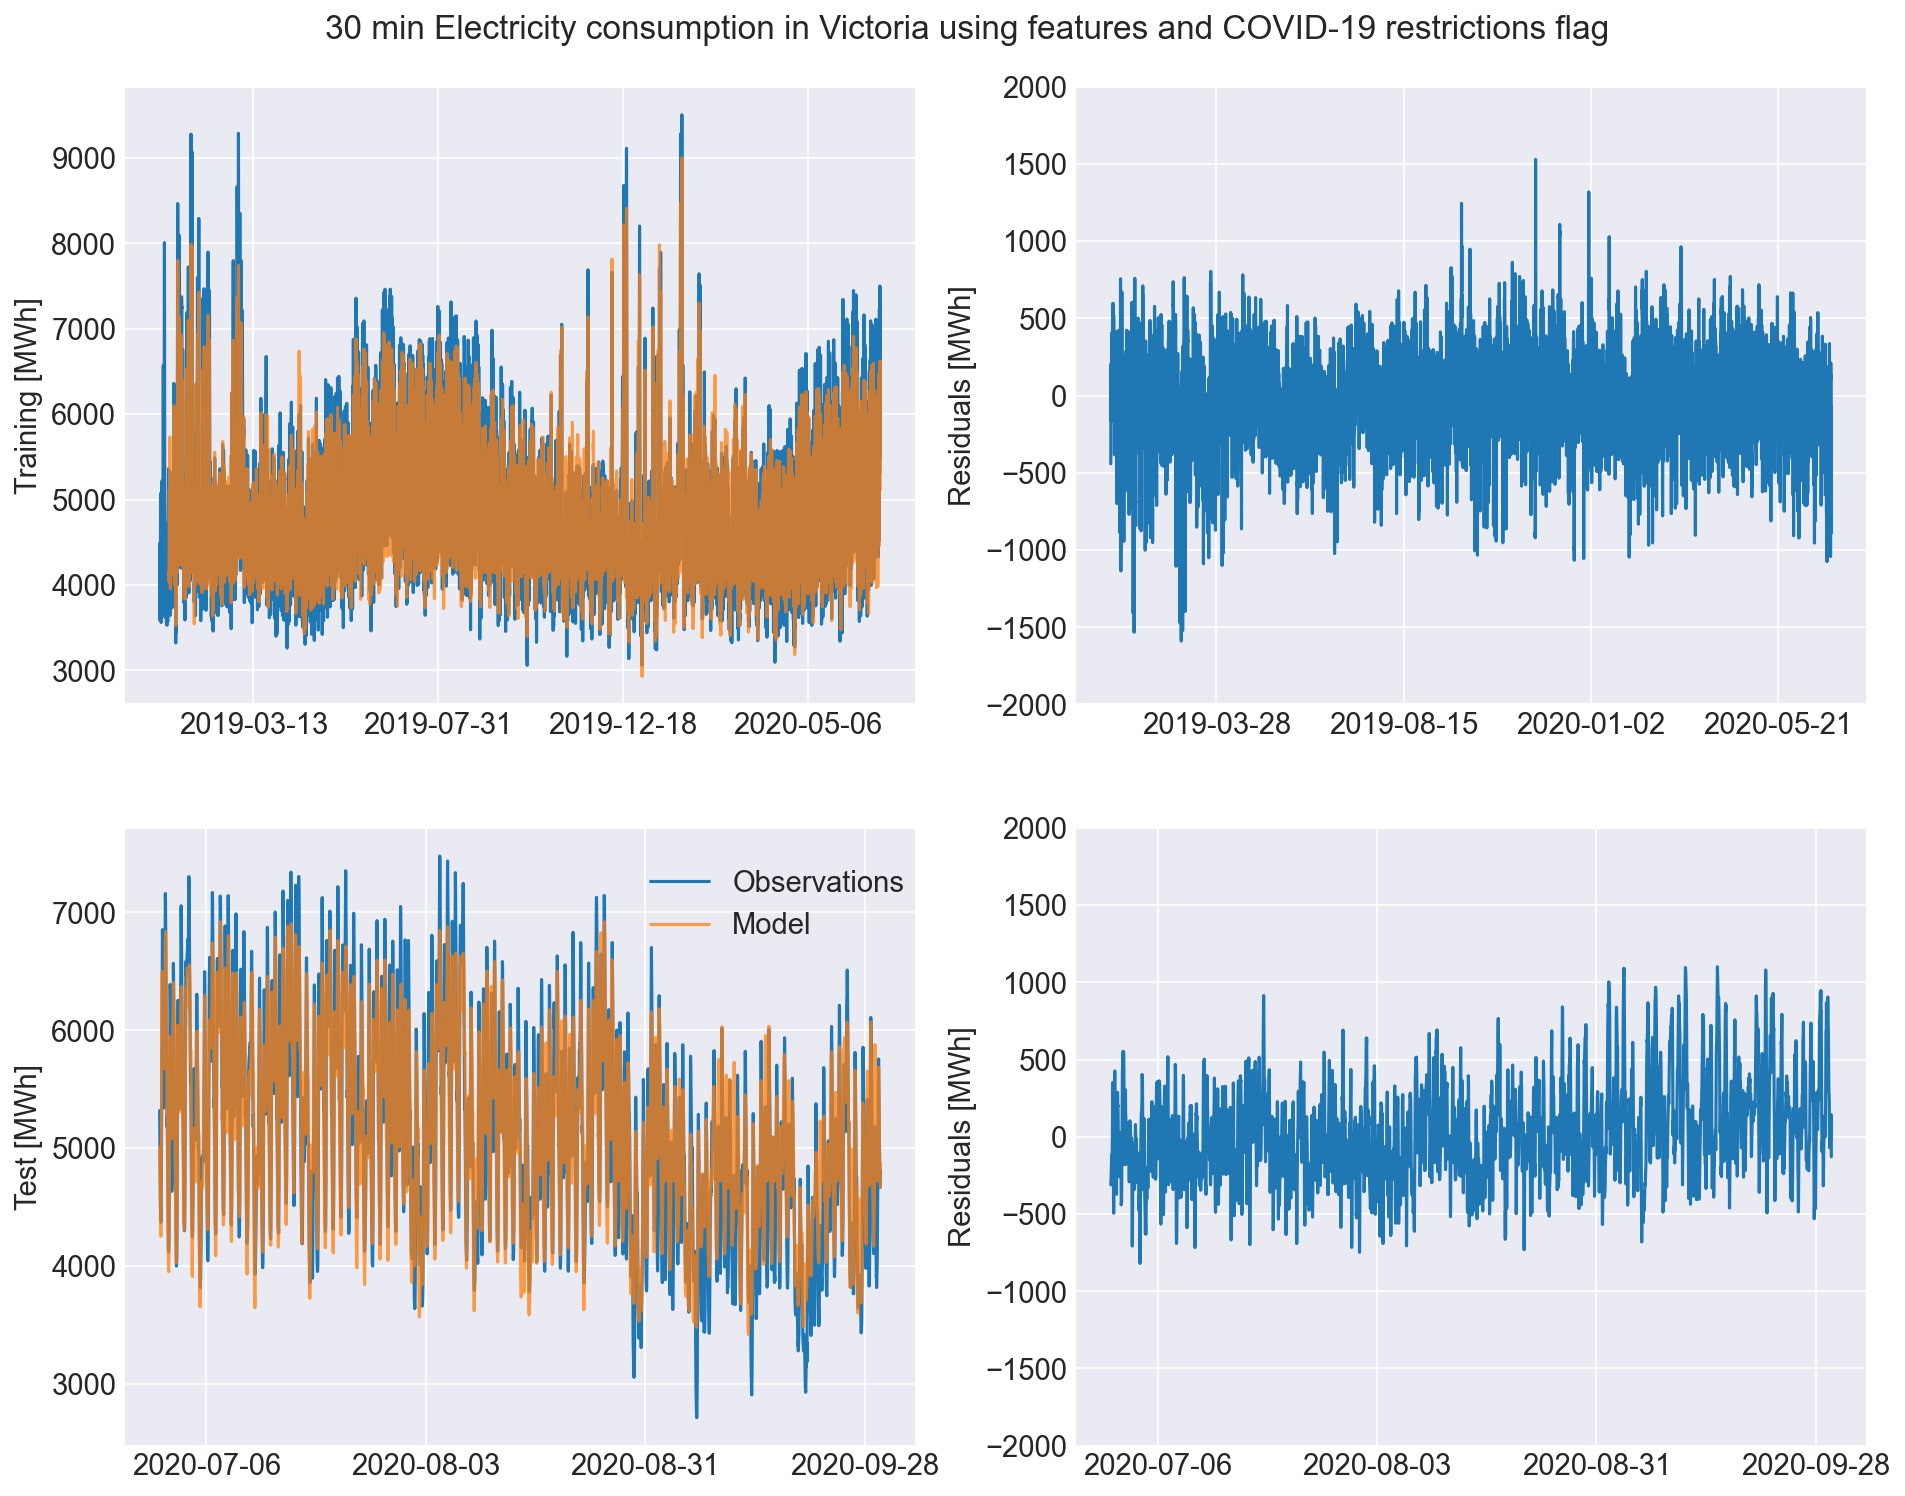
Key takeaway messages from including a flag to represent COVID-19 restrictions include:
- Errors no longer increase as much in the test period.
- There does not appear to be a significant difference between the two models’ forecast capability.
- Further analysis is required to detect a change in forecast capability.
Comparing model forecast densities
Visualising the time series forecasts and resulting residuals is one way to detect a change in forecast behavior. The absence of an obvious distinction between the two models does not indicate that there is no change. An alternative method to compare the model results is to analyse the density plots for the observed and modelled electricity consumption for the training and test period.
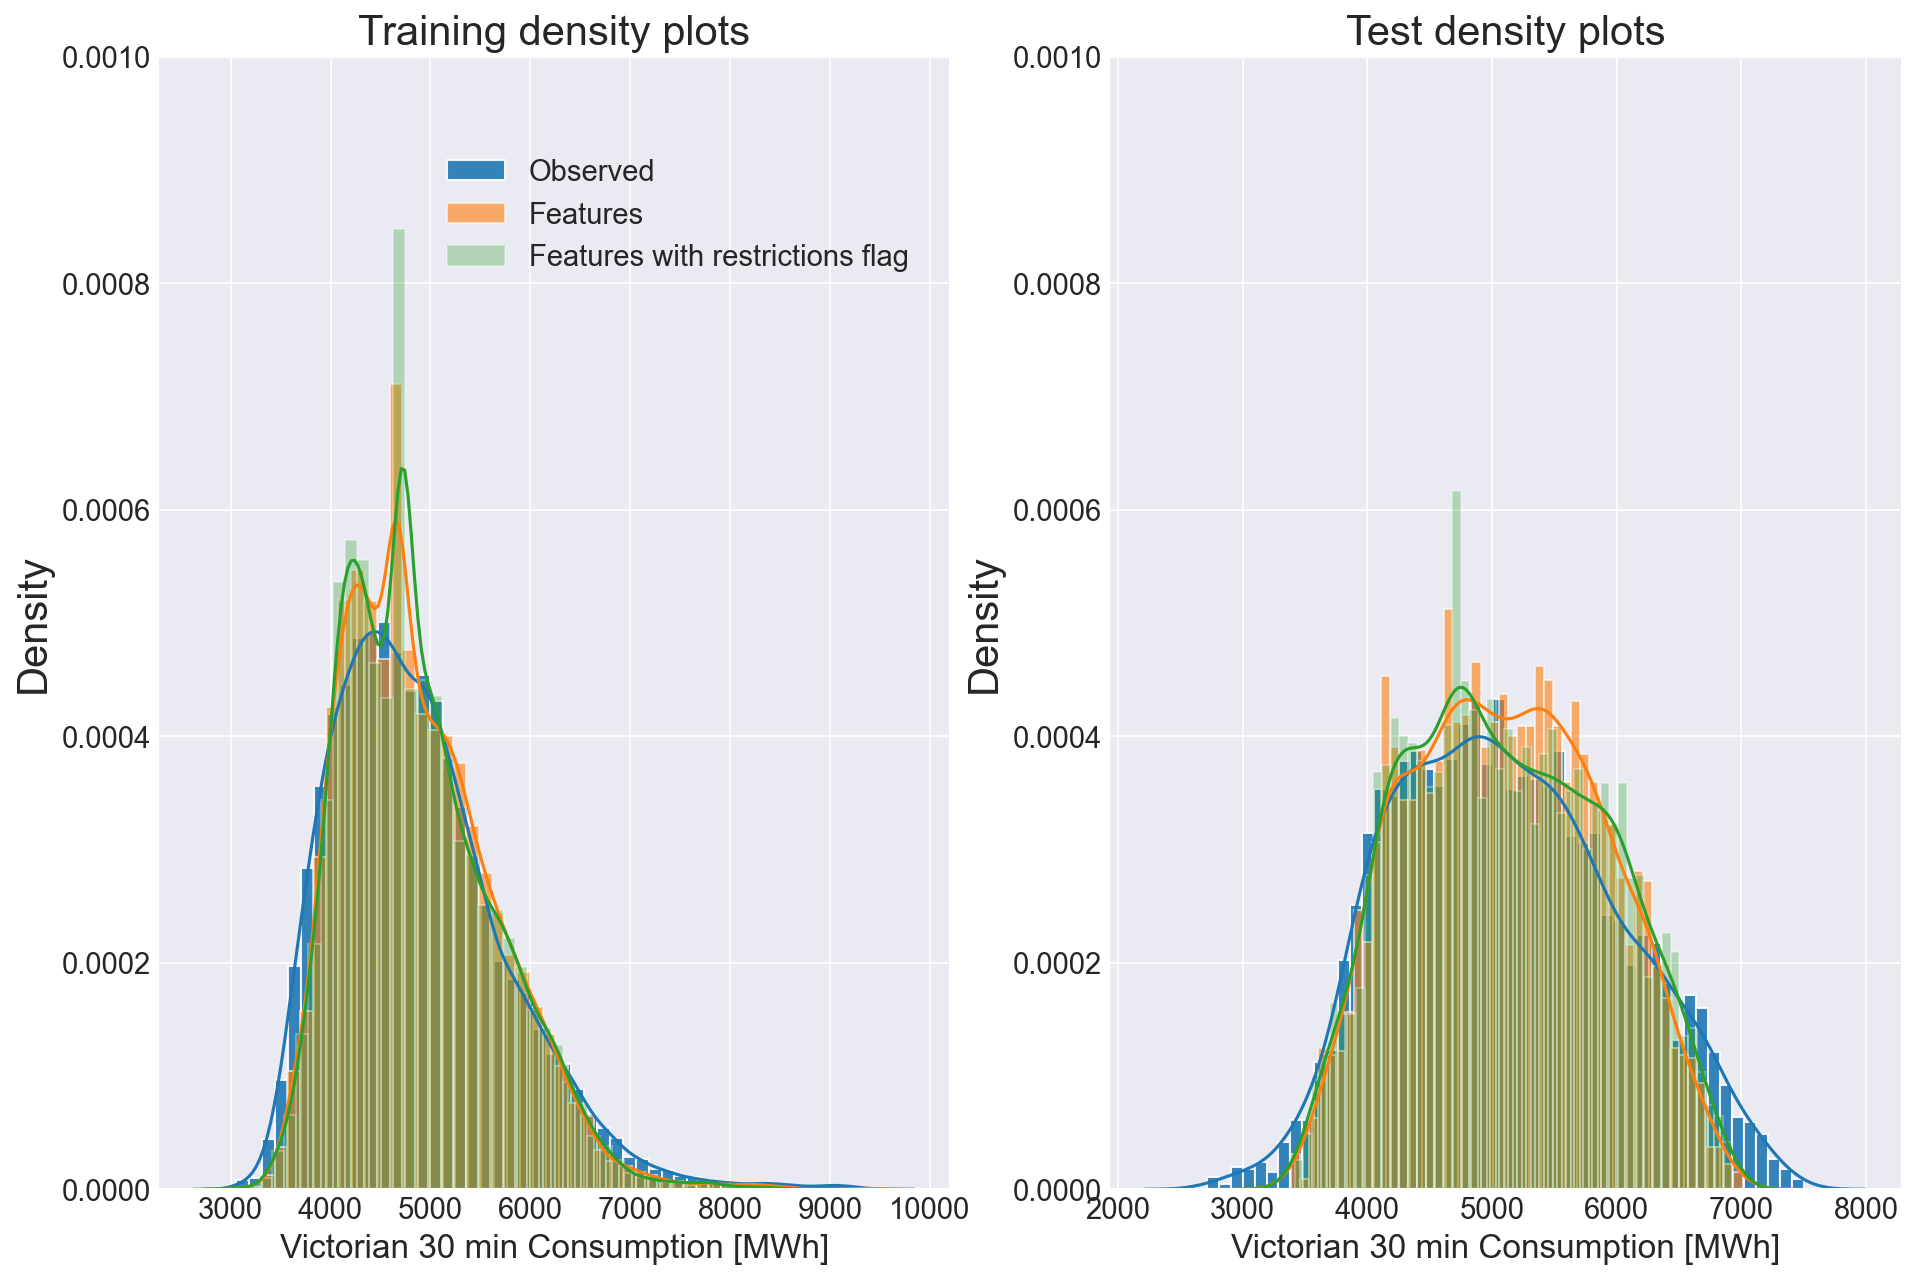
Key takeaway messages from analysing density plots include:
- Both models are able represent the observed density in training relatively well.
- There is a greater difference between the observed and modelled densities in the test period.
- Including a flag for COVID-19 restrictions produces a density which is slightly more representative of the observed density for the test period.
Tracking model drift to detect changes in electricity consumption resulting from COVID-19 restrictions
We have observed a small difference between the density plots in the test period and now move on to check if the two models relative errors are different throughout the COVID-19 restrictions period.
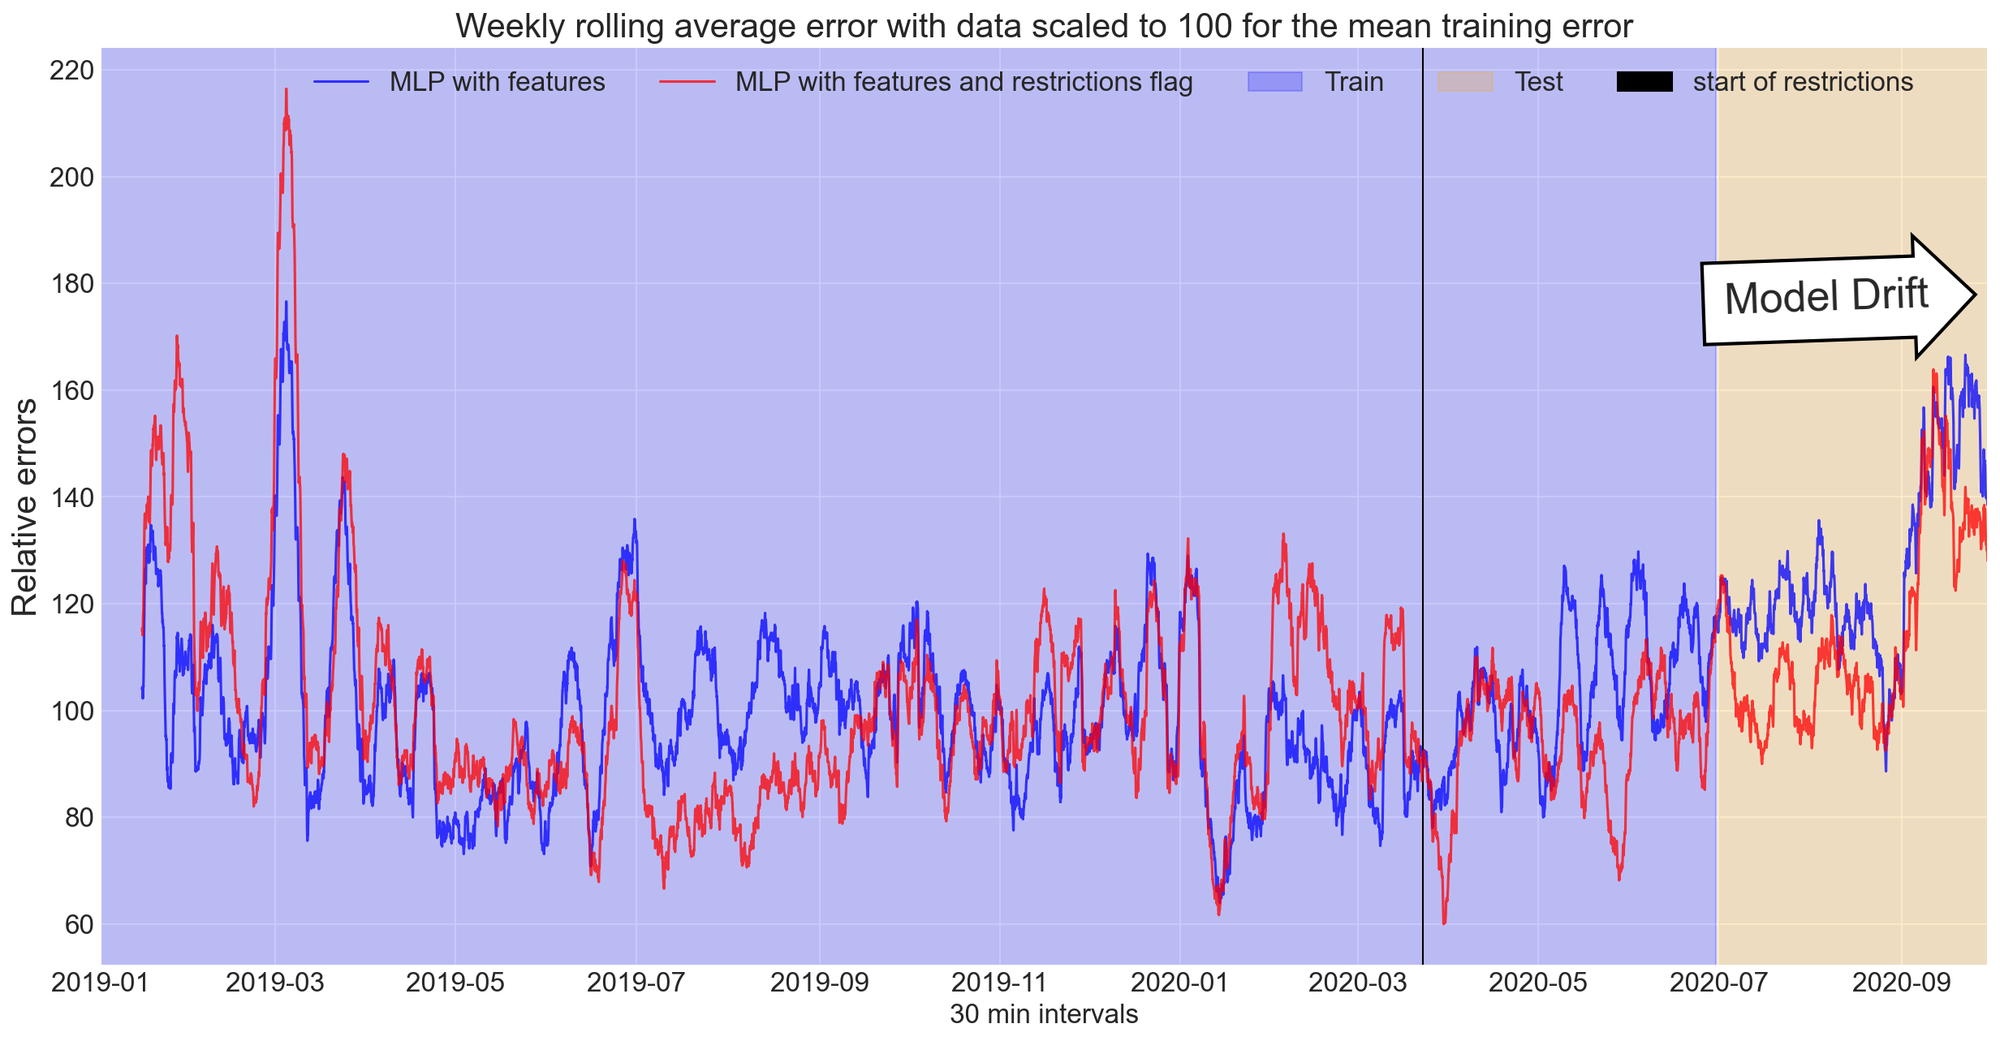
Key takeaway messages from tracking model drift are:
- By including a flag which accounts for COVID-19 restrictions our causal model drifts noticeably less.
- It is possible that the base model even starts to drift in the training period.
- The base model performs slightly better in the training period.
Throughout these blog posts I have used the same neural network and random seed. It is possible that results would differ if an ensemble or different seed was used. I attempted to account for this by training for a large number of epochs and using model checkpoints to select the model which had the best validation period performance.
Reductions in forecast errors by accounting for COVID-19 restrictions
A noticeable drift in relative errors that can be attributed to COVID-19 restrictions in Victoria was observed. We can now quantify these results.
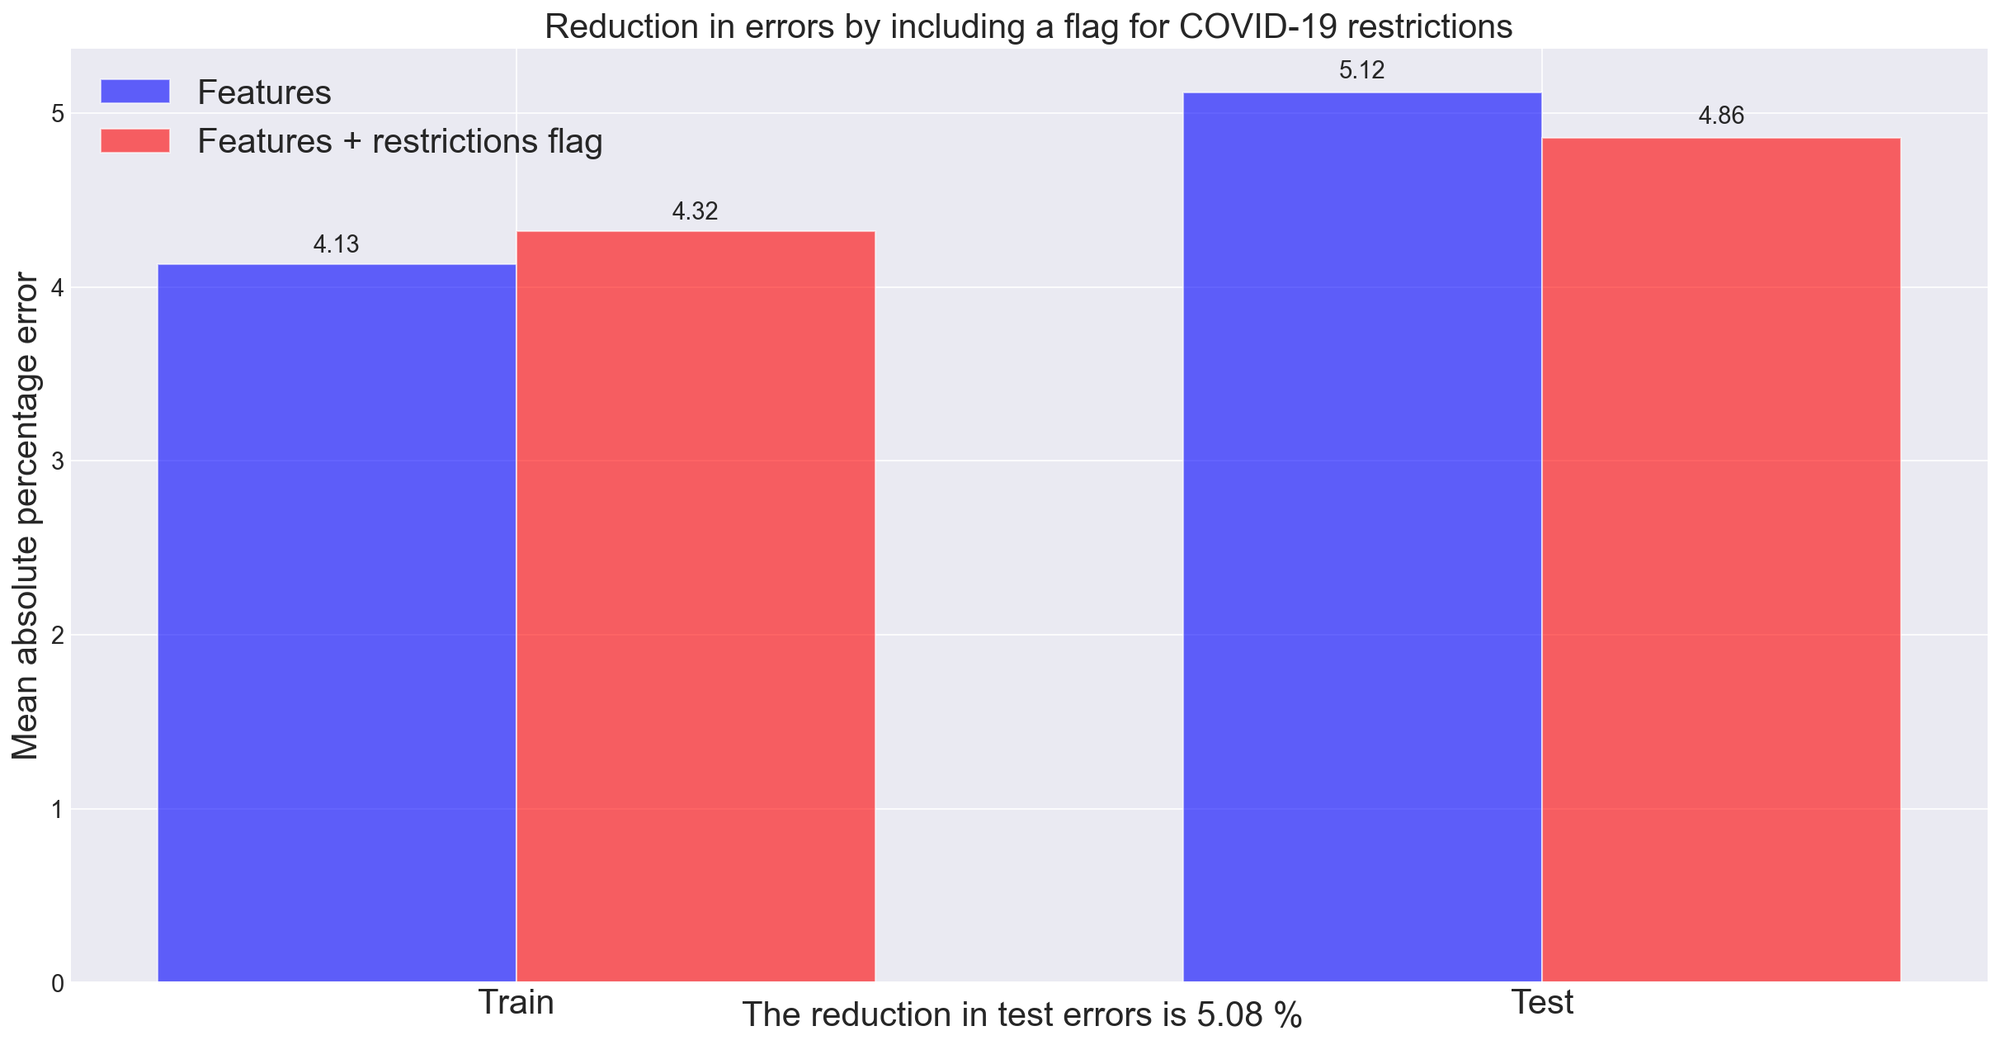
Key takeaway messages using a binary flag to represent COVID-19 restrictions include:
- There is a reduction in errors of 5.08%
- While both models have similar performance it is likely that including the binary flag for COVID-19 restrictions will make the model more robust for future predictions.
- There is less difference between test and training MAPE for the model which includes a binary flag for COVID-19. This suggests the model was less prone to over-fitting.
Summary
This blog post has demonstrated that model forecast errors can be attributed to the change in behaviour that has resulted from COVID-19 restrictions. Furthermore, by including a binary flag which accounts for COVID-19 restrictions our model is more robust and less prone to drift.
Ashley Wright
Research Fellow
These blog posts are exploratory only and should not be considered as advice.